Australia Fly Guide
NSW · Sydney South

Georges River

Imagery © Esri

info

Before you rely on this page

  • Access here has not been confirmed on the ground — treat every way in as unverified.

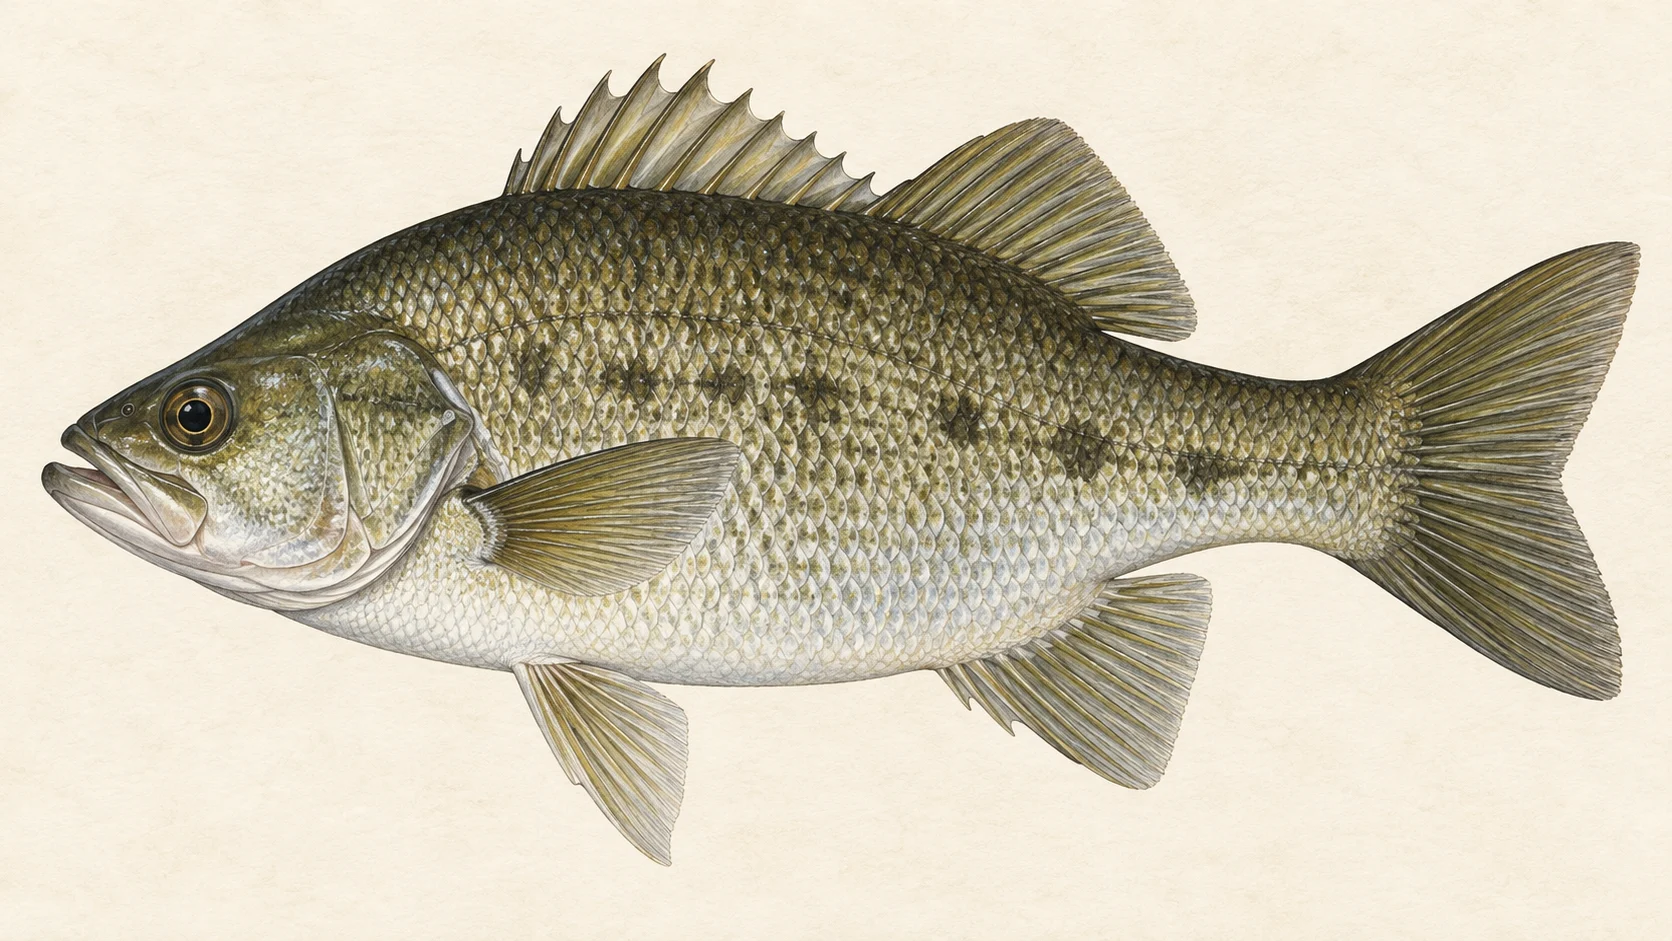
The Georges River is a bass river in New South Wales, and the reason to bring a fly rod is the Australian bass that live in it. It is a river for a light rod, a small box of poppers and baitfish flies, and an evening spent casting tight to the shaded bank.

One structure cuts the river into two parts for a fly angler. A weir at Liverpool marks where the tide stops: below it the river is tidal, and above it the fresh water runs back up to the source, with its tributaries. The two halves fish differently, so pick one per trip.

The easiest trip is below the weir, from a kayak or small boat launched at one of the public ramps on the access card. In our experience bass hold on timber and shaded edges, and a small surface fly at first and last light in the warm months is the place to start. Once the sun is up, switch to a small sunk baitfish fly along the same cover. As on any tidal river where bull sharks may turn up, fish from the boat rather than wading murky edges, and keep your hands out of the water when you land a fish.

The second trip is the fresh river above the weir. The NSW closed-waters notice for those non-tidal waters bans traps, which in practice means you cannot set a trap there; the notice does not itself close the water to fly or line fishing. Walk it with a light rod and a small baitfish fly. Macquarie perch are recorded here too, so look up their status in the current NSW guide before you go.

Start below the weir on a warm evening with a popper, and read the current NSW fishing guide before you launch.

Water and habitat

Liverpool Weir divides the river. Downstream the water rises and falls with the tide. Upstream is fresh, non-tidal water running down from the source through its tributaries.

The gradient profile and the bank cover chart show how the river's fall and its riverside vegetation change along its length. In our experience bass are fish of cover: they sit under overhanging trees, beside fallen timber and in the shade of a steep bank, and they come out to the edges to feed in low light. Read the river for those places first.

Fish and forage

The fish a fly angler comes for is the Australian bass, recorded in the river. Macquarie perch are recorded too; release any you hook with the least handling you can manage, and check the current NSW guide for the species before you fish.

Both longfin and shortfin eels are recorded, as are bullrout and bull sharks. Goldfish and gambusia turn up as well.

The small fish tell you what to tie on. Australian smelt, Pacific blue-eyes and at least six kinds of gudgeon (Cox's, empire, firetail, striped, flathead and dwarf flathead) are recorded in the river. In our experience that means a bass here is looking at slim, drab baitfish a few centimetres long. A size 4 to 8 baitfish fly in olive, grey or brown covers most of it, with a small popper or gurgler for the low-light surface bite.

When to fish it

In our experience bass fish best from spring into autumn, when the water is warm and they will come up to a surface fly at dawn and dusk. Summer evenings after a hot day are a good bet. Once the sun is high, switch to a sunk baitfish fly along shaded cover.

The cold months are usually slower for bass. If you go in winter, fish the middle of the day and slow everything down.

The flow charts show how the river runs through the year at the gauge above the weir. In our experience a river that has just risen and gone brown after rain is a poor bet for a fly; give it a few days to settle.

How to fish it

Rig a five or six weight with a floating line for the surface bite, and carry an intermediate line or a sink tip for the middle of the day. A short, stout leader helps you turn a bass away from a snag.

Accuracy matters more than distance. Put the fly tight to the timber or under the overhang, let a popper sit, then twitch it and let it sit again. With a baitfish fly, count it down beside the cover and bring it back with short, uneven strips and pauses. The streamer fishing guide covers the retrieves.

From a kayak below the weir, drift the shaded bank and cast ahead of the boat so the fly lands before the hull's shadow does.

Access and safety

The access card lists the public boat ramps on the river. Launching from a ramp gets you onto the water; it is not a statement about where you may go ashore, so treat the banks as private unless a sign or the land manager says otherwise.

As on any tidal river where bull sharks may turn up, avoid wading or swimming in murky water, especially at dawn, dusk and after rain, and land and release fish over the side rather than with your hands trailing in the water.

As on any river you paddle, wear a life jacket, carry a way to call for help, and keep clear of larger boats near the ramps.

Regulations

Traps are prohibited in the non-tidal waters of the Georges River and its tributaries upstream from Liverpool Weir to the source, under a NSW closed-waters notice. The notice restricts traps only, so line and fly fishing above the weir are not closed by it.

That is not the whole picture. Before you fish, read the current NSW fishing guide and its closed-waters list for the part of the river you plan to fish, check the bag and size limits and any protection that applies to bass and Macquarie perch, and check whether the recreational fishing fee applies to you.
10 named access sites

These authority-listed points are separate from the mapped track intersections above. Some were inspected and some are public boat-ramp records; each row says which. A listing does not grant permission across private land, so check closures, signs and gates when you arrive.

Sources: Transport for NSW.

When things happen

The guide's calendar for this water

When things happen

The year on this water

A year at a glance; check current rules

  • Bass on surface flies · Oct to Mar In our experience the warm months are the time for bass on top. Fish a small popper or gurgler tight to cover at first and last light.
  • Bass on small baitfish flies · Sep to May Once the sun is on the water, a good bet is a small, drab baitfish pattern fished slower and deeper along snags and shaded banks.
  • Gudgeons and smelt as bass food · Jan to Dec Gudgeons of several kinds and Australian smelt are recorded in the river. In our experience that makes a slim fly a few centimetres long in olive, grey or brown the core of the box.

What the record shows

Flows, river gradient, changing water levels, fish surveys and stocking

What the record shows

The river's year

Daily flow at Georges River at Minto Heights, every year 2011 to 2026

0.05 0.1 0.2 0.5 1 2 5 10 typical range high-flow mark Jan Feb Mar Apr May Jun Jul Aug Sep Oct Nov Dec m³/s
15 years of the gauge, week by week. The dark band is the middle half of all years, the pale band nine years in ten, the line the median. The shaded strip is the typical range: the band the river sits in about half of all days. In a typical year the river sits in it from early April through the turn of the year to mid March, and runs higher than that from mid March to early April. Whether a given day is one to wade is a call made at the bank, not a reading off this chart. Median flow peaks in early April and bottoms out in early December.
Source: Bureau of Meteorology.
Source details and licence

Bureau of Meteorology — Water Data Online series catalogue (Snowy/Monaro stations). Bureau of Meteorology, © Commonwealth of Australia. Licensed from the Commonwealth of Australia under a Creative Commons Attribution 4.0 International licence. retrieved 2026-08-12.

How often it runs this high

5,584 days at Georges River at Minto Heights, 2011 to 2026

0.05 0.1 0.2 0.5 1 2 5 10 20 50 100 typical range 0.054 to 0.444 m³/s high-flow mark 1.285 m³/s 0% of days 25% of days 50% of days 75% of days 100% of days m³/s
Read it left to right: the river runs above the flow on the left edge almost never, and above the flow on the right edge almost always. Half of all days sit below 0.3 m³/s. The shaded band is the typical range, where it sits about half the time; it runs higher than that one day in three and above the high-flow mark about one day in seven. These are frequency bands drawn from the record, not a measured limit — judge the water when you get there.
Source: Bureau of Meteorology.
Source details and licence

Bureau of Meteorology — Water Data Online series catalogue (Snowy/Monaro stations). Bureau of Meteorology, © Commonwealth of Australia. Licensed from the Commonwealth of Australia under a Creative Commons Attribution 4.0 International licence. retrieved 2026-08-12.

The fall of the river

Elevation along the river, source to end

Falls 390 m over 98 km, bedrock bed, confined gorges for much of its length.

-4 194 392 gauge 213018 0 km from the source: 392 m · falling 16.2 m per km · bedrock, headwater 1 km from the source: 341 m · falling 20.5 m per km · bedrock, headwater 2 km from the source: 318 m · falling 20.7 m per km · bedrock, headwater 3 km from the source: 285 m · falling 20.7 m per km · bedrock, headwater 4 km from the source: 255 m · falling 19.6 m per km · bedrock, headwater 5 km from the source: 247 m · falling 13.8 m per km · gravel, occasional floodplain 6 km from the source: 236 m · falling 9.7 m per km · bedrock, headwater 7 km from the source: 235 m · falling 6.8 m per km · bedrock, gorge 8 km from the source: 227 m · falling 5.6 m per km · bedrock, gorge 9 km from the source: 226 m · falling 5.3 m per km · bedrock, gorge 10 km from the source: 224 m · falling 5.6 m per km · bedrock, gorge 11 km from the source: 210 m · falling 5.6 m per km · bedrock, gorge 12 km from the source: 200 m · falling 4.6 m per km · bedrock, gorge 13 km from the source: 205 m · falling 4.3 m per km · bedrock, gorge 14 km from the source: 196 m · falling 4.5 m per km · bedrock, gorge 15 km from the source: 199 m · falling 4.7 m per km · bedrock, gorge 16 km from the source: 195 m · falling 6.1 m per km · bedrock, gorge 17 km from the source: 184 m · falling 7.9 m per km · bedrock, gorge 18 km from the source: 170 m · falling 9 m per km · bedrock, gorge 19 km from the source: 168 m · falling 10.2 m per km · bedrock, gorge 20 km from the source: 156 m · falling 11.1 m per km · bedrock, gorge 21 km from the source: 143 m · falling 11.6 m per km · bedrock, gorge 22 km from the source: 127 m · falling 11.4 m per km · bedrock, gorge 23 km from the source: 119 m · falling 10.6 m per km · bedrock, gorge 24 km from the source: 105 m · falling 9.2 m per km · bedrock, gorge 25 km from the source: 96 m · falling 7.4 m per km · bedrock, gorge 26 km from the source: 90 m · falling 5.7 m per km · bedrock, gorge 27 km from the source: 91 m · falling 4.5 m per km · bedrock, gorge 28 km from the source: 86 m · falling 4 m per km · bedrock, gorge 29 km from the source: 80 m · falling 3.9 m per km · bedrock, gorge 30 km from the source: 77 m · falling 3.8 m per km · bedrock, gorge 31 km from the source: 78 m · falling 4 m per km · bedrock, gorge 32 km from the source: 68 m · falling 3.6 m per km · bedrock, gorge 33 km from the source: 62 m · falling 3 m per km · bedrock, gorge 34 km from the source: 62 m · falling 2.5 m per km · bedrock, gorge 35 km from the source: 61 m · falling 2.8 m per km · bedrock, gorge 36 km from the source: 64 m · falling 3 m per km · bedrock, gorge 37 km from the source: 55 m · falling 3.5 m per km · bedrock, gorge 38 km from the source: 53 m · falling 3.9 m per km · bedrock, gorge 39 km from the source: 41 m · falling 3.6 m per km · bedrock, gorge 40 km from the source: 43 m · falling 3.1 m per km · bedrock, gorge 41 km from the source: 42 m · falling 2.8 m per km · bedrock, gorge 42 km from the source: 39 m · falling 2.4 m per km · bedrock, gorge 43 km from the source: 38 m · falling 2.2 m per km · bedrock, gorge 44 km from the source: 32 m · falling 2.3 m per km · bedrock, gorge 45 km from the source: 29 m · falling 1.6 m per km · bedrock, gorge 46 km from the source: 33 m · falling 1.3 m per km · bedrock, gorge 47 km from the source: 27 m · falling 1.3 m per km · bedrock, gorge 48 km from the source: 27 m · falling 1.3 m per km · bedrock, gorge 49 km from the source: 31 m · falling 1.9 m per km · bedrock, gorge 50 km from the source: 26 m · falling 2.7 m per km · bedrock, gorge 51 km from the source: 21 m · falling 2.6 m per km · bedrock, gorge 52 km from the source: 18 m · falling 2.5 m per km · bedrock, gorge 53 km from the source: 14 m · falling 2.5 m per km · bedrock, gorge 54 km from the source: 12 m · falling 1.9 m per km · bedrock, gorge 55 km from the source: 15 m · falling 1.6 m per km · gravel, discontinuous floodplain 56 km from the source: 13 m · falling 1.5 m per km · gravel, discontinuous floodplain 57 km from the source: 7 m · falling 1.2 m per km · gravel, discontinuous floodplain 58 km from the source: 7 m · falling 0.8 m per km · gravel, discontinuous floodplain 59 km from the source: 7 m · falling 0.8 m per km · gravel, discontinuous floodplain 60 km from the source: 9 m · falling 0.4 m per km · gravel, discontinuous floodplain 61 km from the source: 7 m · falling 0.3 m per km · sand, discontinuous floodplain 62 km from the source: 8 m · falling 0.5 m per km · sand, discontinuous floodplain 63 km from the source: 4 m · falling 0.6 m per km · sand, discontinuous floodplain 64 km from the source: 7 m · falling 0.7 m per km · sand, discontinuous floodplain 65 km from the source: 5 m · falling 0.8 m per km · sand, discontinuous floodplain 66 km from the source: 3 m · falling 0.4 m per km · fine-grained 67 km from the source: 2 m · falling 0 m per km · fine-grained 68 km from the source: 2 m · falling -0.3 m per km · fine-grained 69 km from the source: 2 m · falling -0.6 m per km · fine-grained 70 km from the source: 10 m · falling -0.3 m per km · fine-grained 71 km from the source: 6 m · falling 0 m per km · fine-grained 72 km from the source: 5 m · falling 0.2 m per km · fine-grained 73 km from the source: 3 m · falling 0.3 m per km · fine-grained 74 km from the source: 2 m · falling 0.2 m per km · fine-grained 75 km from the source: 5 m · falling -0.1 m per km · fine-grained 76 km from the source: 5 m · falling 0 m per km · fine-grained 77 km from the source: 5 m · falling 0 m per km · fine-grained 78 km from the source: 4 m · falling 0.2 m per km · fine sediment and sand, discontinuous floodplain 79 km from the source: 4 m · falling 0.2 m per km · fine sediment and sand, discontinuous floodplain 80 km from the source: 2 m · falling 0.2 m per km · fine sediment and sand, discontinuous floodplain 81 km from the source: 5 m · falling 0.3 m per km · fine sediment and sand, discontinuous floodplain 82 km from the source: 3 m · falling 0.6 m per km · fine sediment and sand, discontinuous floodplain 83 km from the source: 7 m · falling 0.9 m per km · fine sediment and sand, discontinuous floodplain 84 km from the source: 0 m · falling 1.1 m per km · fine sediment and sand, discontinuous floodplain 85 km from the source: -1 m · falling 1 m per km · fine sediment and sand, discontinuous floodplain 86 km from the source: -2 m · falling 0.7 m per km · fine sediment and sand, discontinuous floodplain 87 km from the source: -1 m · falling 0.4 m per km · fine sediment and sand, discontinuous floodplain 88 km from the source: -1 m · falling 0 m per km · fine sediment and sand, discontinuous floodplain 89 km from the source: -1 m · falling 0.1 m per km · fine sediment and sand, discontinuous floodplain 90 km from the source: -2 m · falling 0 m per km · fine sediment and sand, discontinuous floodplain 91 km from the source: 0 m · falling 0 m per km · fine sediment and sand, discontinuous floodplain 92 km from the source: 0 m · falling 0.1 m per km · fine sediment and sand, discontinuous floodplain 93 km from the source: -4 m · falling 0 m per km · fine sediment and sand, discontinuous floodplain 94 km from the source: -1 m · falling -0.3 m per km 95 km from the source: 0 m · falling -0.3 m per km 96 km from the source: -1 m · falling -0.4 m per km 97 km from the source: 0 m · falling -0.5 m per km 98 km from the source: 2 m · falling -0.2 m per km 0 km 25 km 49 km 74 km 98 km
bedrock · 55% gravel · 7% sand · 5% fine-grained · 12% fine sediment and sand · 16% not surveyed · 5%
Headwater
392 m
Outlet
2 m
Typical drop
4 m/km
Steepest sampled stretch
20.7 m/km, near 3 km
Hover the profile for the reading at any kilometre.
Source: Geoscience Australia.
Source details and licence

Geoscience Australia — 1 second SRTM-derived DEM-H v1.0 (NCI tile store). Geoscience Australia, 1 second SRTM-derived DEM-H v1.0, © Commonwealth of Australia, CC BY 4.0. retrieved 2026-08-16.

Bed material: NSW Department of Climate Change, Energy, the Environment and Water (Water, Surface Water Science).
Source details and licence

NSW River Styles spatial dataset — geomorphic character and dominant bed material. NSW River Styles spatial dataset, © State Government of NSW and NSW Department of Climate Change, Energy, the Environment and Water 2023. retrieved 2026-08-21.

Gauge pins identify the monitoring stations. The slope shows how steeply the river falls; it does not show rapids or safe wading routes.

The banks, seen from space

Land cover in the 120 m beside the water, Landsat 2023 to 2024 to 2025

0 to 10 km: woody dense 59.4% 0 to 10 km: woody open 37.8% 0 to 10 km: woody sparse 0.6% 0 to 10 km: herbaceous native 0.9% 0 to 10 km: cultivated 1.3% 10 to 20 km: woody dense 95% 10 to 20 km: woody open 5% 20 to 30 km: woody dense 92.5% 20 to 30 km: woody open 7.5% 30 to 40 km: woody dense 69.6% 30 to 40 km: woody open 30.1% 30 to 40 km: woody sparse 0.3% 40 to 50 km: woody dense 79.1% 40 to 50 km: woody open 20.9% 50 to 60 km: woody dense 53.9% 50 to 60 km: woody open 25.4% 50 to 60 km: woody sparse 2.2% 50 to 60 km: herbaceous native 7.5% 50 to 60 km: cultivated 9.1% 50 to 60 km: artificial 1.9% 60 to 70 km: woody dense 19% 60 to 70 km: woody open 25.9% 60 to 70 km: woody sparse 0.8% 60 to 70 km: herbaceous native 7.3% 60 to 70 km: cultivated 23.5% 60 to 70 km: artificial 23.5% 70 to 80 km: woody dense 24.9% 70 to 80 km: woody open 34.7% 70 to 80 km: woody sparse 3.6% 70 to 80 km: herbaceous native 6.1% 70 to 80 km: cultivated 18.1% 70 to 80 km: artificial 12.6% 80 to 90 km: woody dense 53.2% 80 to 90 km: woody open 35.6% 80 to 90 km: woody sparse 2.8% 80 to 90 km: herbaceous native 1.7% 80 to 90 km: cultivated 6.1% 80 to 90 km: artificial 0.6% 90 to 100 km: woody dense 12.8% 90 to 100 km: woody open 30.2% 90 to 100 km: herbaceous native 2.3% 90 to 100 km: cultivated 20.9% 90 to 100 km: bare 1.2% 90 to 100 km: artificial 32.6% 0 km 20 km 40 km 60 km 80 km 100 km
dense forest open woodland scattered trees and scrub native grass and heath farmed or cleared bare ground lake
Along the river itself about 86% of the bank is under trees, 3% is native grass or heath and 6% is farmed. The most wooded stretch is 10 to 20 km from the source; the most open is 90 to 100 km. A satellite reads the canopy, not the ground beneath it, so treat this as a read of the country, not a survey of every bank.
Source: Geoscience Australia / Digital Earth Australia.
Source details and licence

DEA Land Cover (Landsat) — Level 4 classification, continental mosaics. © Commonwealth of Australia (Geoscience Australia). DEA Land Cover (Landsat), Digital Earth Australia. retrieved 2026-08-19.

How well this water has been surveyed

22 capture records, 2 decades of 2 on file

0 5 10 15 20 2000s: 2 capture records 2000s: 1 capture record 2010s: 2 capture records 2010s: 17 capture records 2000s 2010s
electrofishing (boat), 2 records electrofishing (backpack), 3 records seine netting, 17 records
Capture records by decade — electrofishing, netting, trapping and rotenone surveys only; a sighting, an eDNA water sample or a stocking release is not a capture and is not counted here. A record is not an abundance estimate, and a decade with no bar is a decade with no capture survey on file, not evidence the water was empty.
Source: Atlas of Living Australia.
Source details and licence

Atlas of Living Australia — freshwater fish occurrence records (open licences, with coordinates). Occurrence records from the Atlas of Living Australia and its contributing datasets, including the Victorian Biodiversity Atlas, NSW BioNet Atlas, Sustainable Rivers Audit, Murray-Darling Basin fish monitoring programs, OZCAM museum collections and iNaturalist Australia. Each record carries its own licence and originating dataset. retrieved 2026-08-13.

Conditions

What the gauges say

Georges River at Minto Heights

River flow

No reading shown: No reading has been captured for this gauge yet, so none is shown.

Gauge height

No reading shown: No reading has been captured for this gauge yet, so none is shown.

Readings from the Bureau of Meteorology's Water Data Online, © Commonwealth of Australia, licensed CC BY 4.0. Nothing here is a forecast. Check the gauge before you rely on it.

Weather

What the sky is doing

Live weather for Georges River at Minto Heights loads here. If it does not, check the Bureau of Meteorology forecast before you go.

Weather data by Open-Meteo.com

Questions anglers ask

What should I target on fly in the Georges River?

Australian bass. They are recorded in the river, and in our experience they are the fish a fly angler is best set up for here: a small surface fly at low light and a small baitfish pattern through the day, cast tight to cover.

Can I fly fish above Liverpool Weir?

The NSW closed-waters notice for the non-tidal Georges River and its tributaries above Liverpool Weir prohibits traps only; it does not itself close the water to line fishing. Check the current NSW guide for anything else that applies before you fish.

What if I hook a Macquarie perch?

Macquarie perch are recorded in the river. Look the species up in the current NSW fishing guide before you go so you know its status, and if one takes your fly, keep it in the water, unhook it quickly and let it go.

Where do I launch a kayak or small boat?

The access card lists the public boat ramps on the river. They are launching places, not guides to where the fish are; paddle from there to the snags and shaded edges.

Behind this page