Australia Fly Guide
NSW · Clarence River

Nymboida River

Imagery © Esri

info

Before you rely on this page

  • Access here has not been confirmed on the ground — treat every way in as unverified.

The Nymboida is a river in the Coffs District of NSW that runs into the Mann, and the reason to fish it with a fly rod is Australian bass eating off the top after dark. Bring a surface fly and plan to stay out past sunset.

Think of it as a river in two parts. The line between them is where Wild Cattle Creek comes in. Above that junction the river and its creeks are a listed general trout water; below it, the river runs on down to the Mann. The gradient chart shows where the bed runs steep and where it lays back, and the slower, flatter water is where you want to be for bass and catfish.

The first trip, and the easiest, is bass on the surface from one of the access sites the card names. Go on a warm night between November and March, fish a bulky surface fly slowly along the edges as the light fades, and keep fishing once it is dark. The river holds eastern freshwater cod as well as bass, and at night you often cannot tell which fish took the fly until it is at your feet, so read what the current NSW guide says about cod before your first cast.

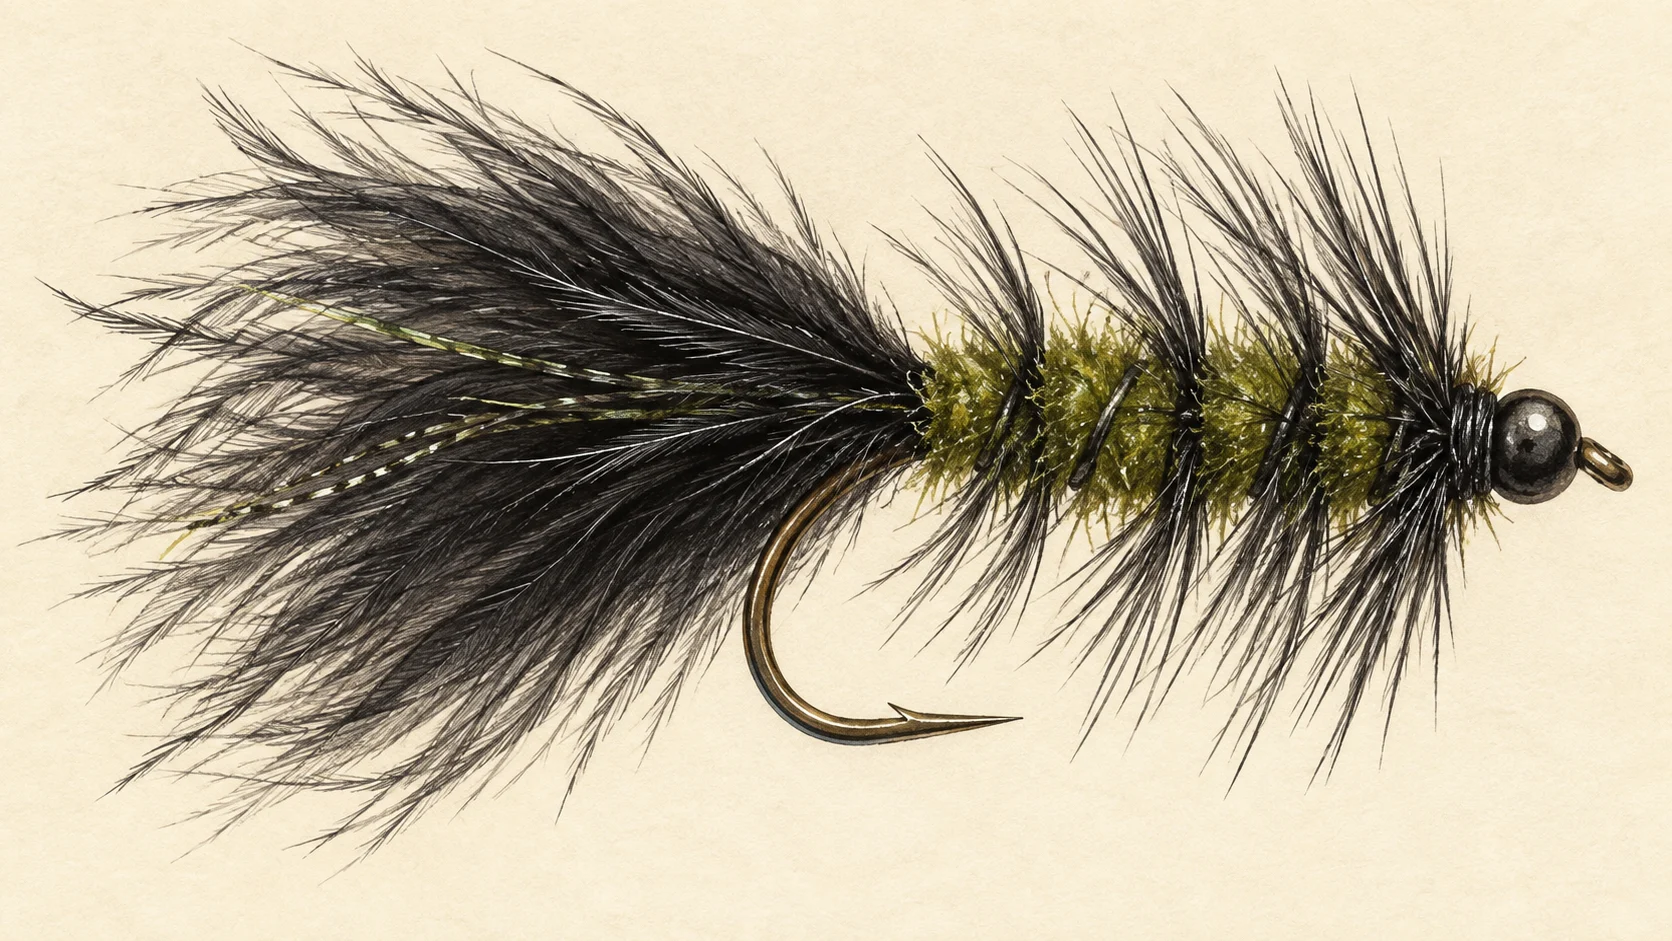
The second trip is freshwater catfish on the same evening. They are recorded here and feed along the bottom of pools, so switch to a weighted dark fly on a sinking tip, let it reach the sand and gravel, and inch it back. A good bet while you wait for full dark.

The third is the upper river. Because it is a listed general trout water from the Wild Cattle Creek junction upstream, you need the current NSW guide to know what that listing means for when you may fish it. Trout are not among the fish recorded in the Nymboida, so we would not drive up for the headwaters; start lower, in bass water.

Pack a head torch and a box of surface flies, check the current NSW guide, and be on the water an hour before dark.

Water and habitat

The Nymboida flows into the Mann. Along its length the character is set by slope: the gradient profile shows the steeper and flatter stretches, and the flow charts show how often the river runs high or low and how that shifts through the year. In our experience bass in a river like this hold under overhanging trees, beside fallen timber and in the slack water off the edge of a run, then move out over the shallows at night to feed. The bank cover chart gives you a sense of how much of the river is shaded and treed.

Catfish want a different kind of water: longer pools with a soft or gravelly floor, and the tail of a pool where the bottom comes up to meet a run.

In our experience it is warm water that puts bass on the surface at night, so plan a trip here around the warm months.

Fish and forage

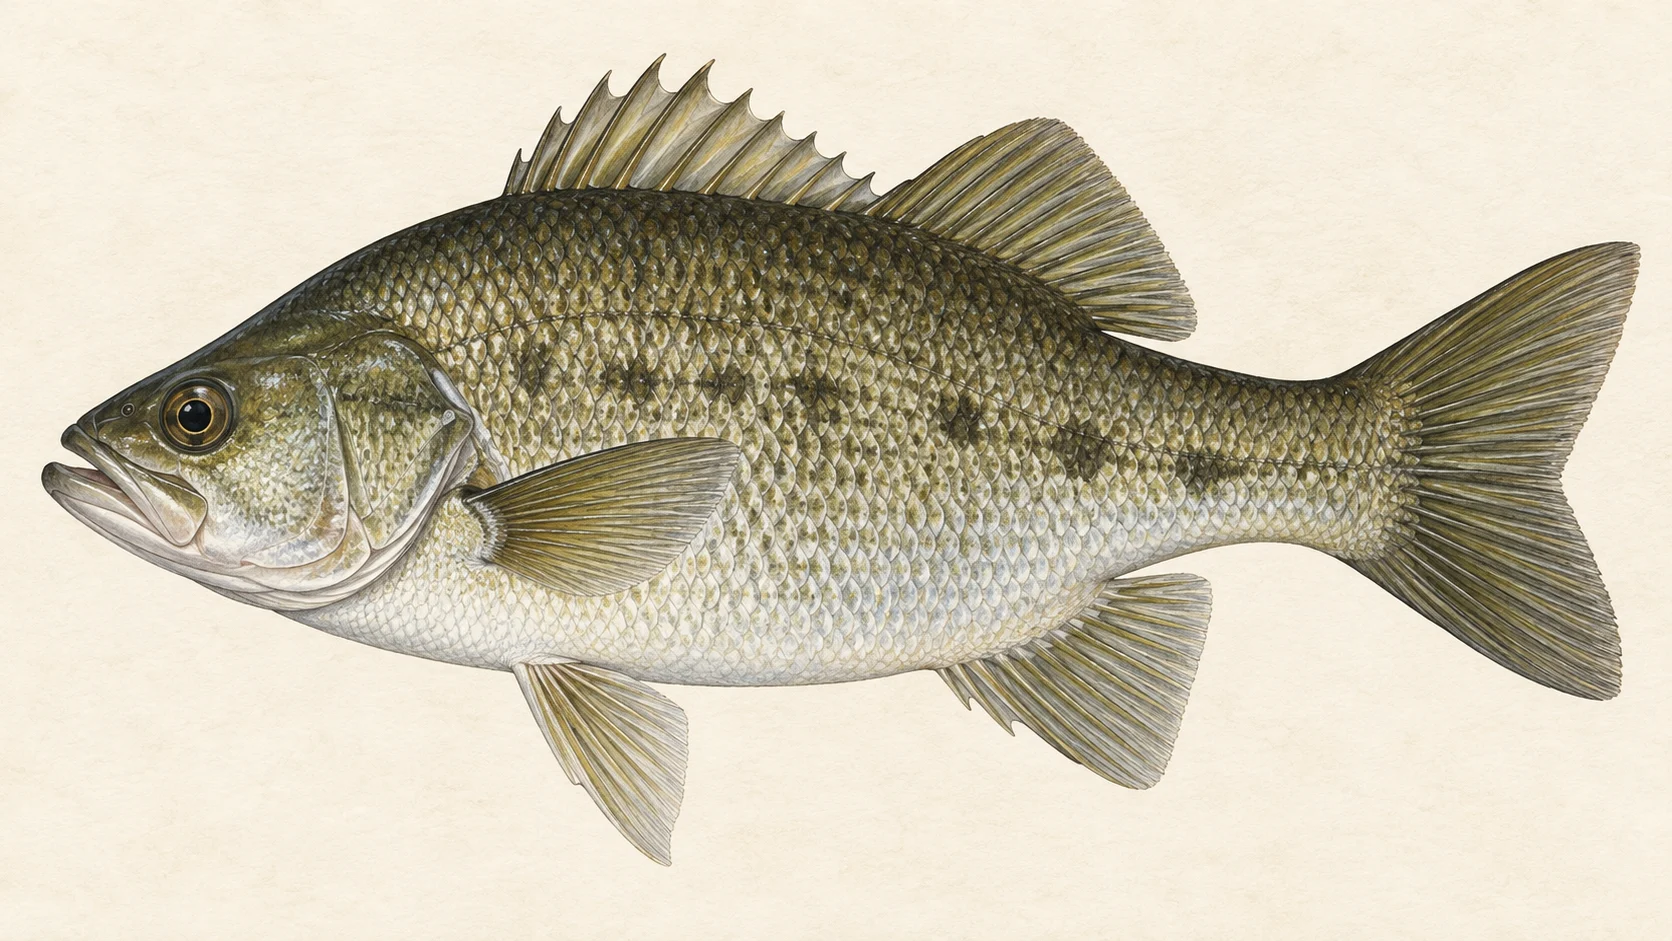
Australian bass are the fish to plan around, and they share the river with eastern freshwater cod. Both will come up to a noisy fly at night. Freshwater catfish are the other realistic fly target, feeding by feel along the bottom. Longfin eels are also recorded here, and if you fish after dark one may take a bottom fly now and then.

Underneath them is a list of small natives recorded in the river: Australian smelt, several kinds of gudgeon, crimson-spotted rainbowfish, Marjorie's hardyhead and mountain galaxias. These are the forage, and a slim streamer in olive or grey is the closest thing the river has to a universal fly.

Carry a few bulky surface flies in 2 to 6 for bass at night, dark Woolly Buggers in 6 to 10, weighted, for catfish, and some small baitfish patterns in 10 to 12 for the edges in daylight.

When to fish it

Summer is our pick. From November through March the nights are warm and bass feed on top, often best from the last of the light into the first couple of hours of dark. Spring can fish as the water warms. Winter is slow for surface fishing in a river like this, and we would leave it.

Watch the rain. After heavy rain a river like this can run high and coloured for days; the live conditions card is the place to check the level before you leave. Give it time to drop and clear.

How to fish it

A six- or seven-weight with a floating line covers the surface fishing. Use a short, stout leader, because at night the fish are not leader shy and the timber is close.

Cast tight to the edges and into the shade, let the fly sit until the rings die, then bring it back in slow pops and long pauses. At night, slow down further and fish by sound. When you hear the take, wait for the weight before you set, because a bass or cod that has only swirled at the fly will often come back for it.

For catfish, change to a sinking tip, cast across and slightly upstream into the slower water, and bring the fly back in short, slow pulls with long pauses along the bottom. Where trees crowd the bank, a roll cast saves flies. In daylight, work a small baitfish pattern along shaded banks with a slow strip; the streamer guide covers the retrieve.

Access and safety

The access card names the places to start. It describes where the river can be reached; it is not permission to walk the banks beyond it. Assume the banks beyond are private, ask before you cross a paddock, and leave every gate as you found it.

As on any river fished after dark, learn the bank in daylight before you fish it at night, carry a head torch and a spare, and tell someone where you have gone. Check, clean and dry your boots and gear before you fish another river.

Regulations

Under NSW's trout and salmon fishing rules, the Nymboida is classified as a general trout water in the Coffs District. The listing starts where Wild Cattle Creek joins and takes in everything above that point: the main river, every creek and tributary feeding it, and Wild Cattle Creek as well. Check the current NSW guide for the season that applies to general trout waters before you fish that part of the river.

For the rest of the river, and for bass, cod and catfish anywhere on it, check the current NSW Department of Primary Industries and Regional Development guide, including its closed-waters list and anything it says about eastern freshwater cod, before you fish.

Before you leave, open the current NSW fishing rules and regulations, confirm the fishing fee and exemptions and check the freshwater bag and size limits.
3 named access sites

These authority-listed points are separate from the mapped track intersections above. Some were inspected and some are public boat-ramp records; each row says which. A listing does not grant permission across private land, so check closures, signs and gates when you arrive.

Sources: NSW Department of Primary Industries and Regional Development.

When things happen

The guide's calendar for this water

When things happen

The year on this water

A year at a glance; check current rules

  • Surface flies after dark · Nov to Mar A guide's read, not a record. Warm nights are when bass feed noisily on top; fish a bulky surface fly slowly through the last light and into the dark.
  • Catfish on the bottom · Nov to Mar A guide's read, not a record. Crawl a weighted dark Woolly Bugger over sand and gravel on a warm evening.
  • Small natives in the shallows · Oct to Apr Smelt, gudgeons, rainbowfish, hardyheads and mountain galaxias are all recorded here. They are what the bigger fish eat, so carry a slim streamer to match them.

What the record shows

Flows, river gradient, changing water levels, fish surveys and stocking

What the record shows

The river's year

Daily flow at Nymboida River D/s Nymboida Weir, every year 1997 to 2026

2 5 10 20 50 100 200 typical range high-flow mark Jan Feb Mar Apr May Jun Jul Aug Sep Oct Nov Dec m³/s
29 years of the gauge, week by week. The dark band is the middle half of all years, the pale band nine years in ten, the line the median. The shaded strip is the typical range: the band the river sits in about half of all days. In a typical year the river sits in it from late April through the turn of the year to late January, and runs higher than that from early February to late April. Whether a given day is one to wade is a call made at the bank, not a reading off this chart. Median flow peaks in early March and bottoms out in mid October.
Source: Bureau of Meteorology.
Source details and licence

Bureau of Meteorology — Water Data Online series catalogue (Snowy/Monaro stations). Bureau of Meteorology, © Commonwealth of Australia. Licensed from the Commonwealth of Australia under a Creative Commons Attribution 4.0 International licence. retrieved 2026-08-12.

How often it runs this high

10,525 days at Nymboida River D/s Nymboida Weir, 1997 to 2026

0.5 1 2 5 10 20 50 100 200 500 typical range 3.053 to 12.545 m³/s high-flow mark 29.288 m³/s 0% of days 25% of days 50% of days 75% of days 100% of days m³/s
Read it left to right: the river runs above the flow on the left edge almost never, and above the flow on the right edge almost always. Half of all days sit below 7.5 m³/s. The shaded band is the typical range, where it sits about half the time; it runs higher than that one day in three and above the high-flow mark about one day in seven. These are frequency bands drawn from the record, not a measured limit — judge the water when you get there.
Source: Bureau of Meteorology.
Source details and licence

Bureau of Meteorology — Water Data Online series catalogue (Snowy/Monaro stations). Bureau of Meteorology, © Commonwealth of Australia. Licensed from the Commonwealth of Australia under a Creative Commons Attribution 4.0 International licence. retrieved 2026-08-12.

The fall of the river

Elevation along the river, source to end

Falls 1294 m over 175 km, gravel bed, confined gorges for much of its length.

117 764 1,411 gauge 204069 0 km from the source: 1411 m · falling 22.9 m per km 1 km from the source: 1276 m · falling 31 m per km · bedrock, headwater 2 km from the source: 1225 m · falling 28.5 m per km · bedrock, headwater 3 km from the source: 1193 m · falling 24.4 m per km · bedrock, headwater 4 km from the source: 1187 m · falling 21.4 m per km · fine-grained, discontinuous floodplain 5 km from the source: 1175 m · falling 12 m per km · fine-grained, discontinuous floodplain 6 km from the source: 1171 m · falling 10.5 m per km · fine-grained, discontinuous floodplain 7 km from the source: 1168 m · falling 13.5 m per km · fine-grained, discontinuous floodplain 8 km from the source: 1163 m · falling 18.8 m per km · fine-grained, discontinuous floodplain 9 km from the source: 1138 m · falling 25 m per km · bedrock, gorge 10 km from the source: 1100 m · falling 34 m per km · bedrock, gorge 11 km from the source: 1054 m · falling 40.7 m per km · bedrock, gorge 12 km from the source: 1033 m · falling 45.8 m per km · bedrock, gorge 13 km from the source: 991 m · falling 48.9 m per km · bedrock, gorge 14 km from the source: 884 m · falling 47.9 m per km · bedrock, gorge 15 km from the source: 848 m · falling 41.8 m per km · bedrock, gorge 16 km from the source: 818 m · falling 35 m per km · bedrock, gorge 17 km from the source: 798 m · falling 27.5 m per km · bedrock, gorge 18 km from the source: 756 m · falling 19.7 m per km · bedrock, gorge 19 km from the source: 755 m · falling 15.1 m per km · bedrock, gorge 20 km from the source: 747 m · falling 12.1 m per km · bedrock, gorge 21 km from the source: 733 m · falling 10 m per km · bedrock, gorge 22 km from the source: 720 m · falling 7.7 m per km · bedrock, gorge 23 km from the source: 718 m · falling 7.1 m per km · bedrock, gorge 24 km from the source: 714 m · falling 6.4 m per km · bedrock, gorge 25 km from the source: 704 m · falling 5.8 m per km · bedrock, gorge 26 km from the source: 700 m · falling 5.3 m per km · bedrock, gorge 27 km from the source: 694 m · falling 5.4 m per km · bedrock, gorge 28 km from the source: 691 m · falling 5.5 m per km · bedrock, gorge 29 km from the source: 684 m · falling 5.7 m per km · bedrock, gorge 30 km from the source: 680 m · falling 6.3 m per km · bedrock, gorge 31 km from the source: 673 m · falling 7 m per km · bedrock, gorge 32 km from the source: 666 m · falling 7.6 m per km · bedrock, gorge 33 km from the source: 657 m · falling 7.4 m per km · bedrock, gorge 34 km from the source: 648 m · falling 6.9 m per km · bedrock, gorge 35 km from the source: 638 m · falling 6.1 m per km · bedrock, gorge 36 km from the source: 633 m · falling 5.5 m per km · bedrock, gorge 37 km from the source: 635 m · falling 5.7 m per km · bedrock, gorge 38 km from the source: 631 m · falling 6.6 m per km · bedrock, gorge 39 km from the source: 622 m · falling 8.3 m per km · bedrock, gorge 40 km from the source: 610 m · falling 9.7 m per km · bedrock, gorge 41 km from the source: 598 m · falling 10.4 m per km · bedrock, gorge 42 km from the source: 591 m · falling 10.5 m per km · bedrock, gorge 43 km from the source: 571 m · falling 9.7 m per km · bedrock, gorge 44 km from the source: 567 m · falling 8.7 m per km · bedrock, gorge 45 km from the source: 560 m · falling 8 m per km · bedrock, gorge 46 km from the source: 554 m · falling 7.7 m per km · bedrock, gorge 47 km from the source: 547 m · falling 7.4 m per km · bedrock, gorge 48 km from the source: 536 m · falling 7.7 m per km · bedrock, gorge 49 km from the source: 532 m · falling 8.1 m per km · bedrock, gorge 50 km from the source: 520 m · falling 8.7 m per km · bedrock, gorge 51 km from the source: 516 m · falling 9.5 m per km · bedrock, gorge 52 km from the source: 506 m · falling 9.9 m per km · bedrock, gorge 53 km from the source: 494 m · falling 10.6 m per km · bedrock, gorge 54 km from the source: 478 m · falling 10.6 m per km · bedrock, gorge 55 km from the source: 467 m · falling 9.9 m per km · bedrock, gorge 56 km from the source: 467 m · falling 10.1 m per km · bedrock, gorge 57 km from the source: 449 m · falling 10 m per km · bedrock, gorge 58 km from the source: 441 m · falling 9.2 m per km · bedrock, gorge 59 km from the source: 439 m · falling 9 m per km · bedrock, gorge 60 km from the source: 415 m · falling 8.2 m per km · gravel, occasional floodplain 61 km from the source: 412 m · falling 6.2 m per km · gravel, occasional floodplain 62 km from the source: 413 m · falling 5.7 m per km · gravel, occasional floodplain 63 km from the source: 404 m · falling 5.2 m per km · gravel, occasional floodplain 64 km from the source: 403 m · falling 4.8 m per km · gravel, occasional floodplain 65 km from the source: 399 m · falling 5.7 m per km · gravel, occasional floodplain 66 km from the source: 387 m · falling 5.9 m per km · gravel, occasional floodplain 67 km from the source: 386 m · falling 6.1 m per km · gravel, occasional floodplain 68 km from the source: 377 m · falling 6.4 m per km · gravel, occasional floodplain 69 km from the source: 368 m · falling 5.6 m per km · gravel, occasional floodplain 70 km from the source: 369 m · falling 5.3 m per km · gravel, occasional floodplain 71 km from the source: 357 m · falling 5.3 m per km · gravel, occasional floodplain 72 km from the source: 351 m · falling 4.9 m per km · gravel, occasional floodplain 73 km from the source: 359 m · falling 5.5 m per km · gravel, occasional floodplain 74 km from the source: 345 m · falling 7.8 m per km · gravel, occasional floodplain 75 km from the source: 339 m · falling 8.7 m per km · gravel, occasional floodplain 76 km from the source: 330 m · falling 10 m per km · gravel, occasional floodplain 77 km from the source: 321 m · falling 11.2 m per km · gravel, occasional floodplain 78 km from the source: 292 m · falling 10.5 m per km · gravel, occasional floodplain 79 km from the source: 295 m · falling 10 m per km · gravel, occasional floodplain 80 km from the source: 287 m · falling 9.4 m per km · gravel, occasional floodplain 81 km from the source: 277 m · falling 9 m per km · gravel, occasional floodplain 82 km from the source: 266 m · falling 8.5 m per km · gravel, occasional floodplain 83 km from the source: 253 m · falling 8.2 m per km · gravel, occasional floodplain 84 km from the source: 254 m · falling 7.2 m per km · gravel, occasional floodplain 85 km from the source: 242 m · falling 6.5 m per km · gravel, occasional floodplain 86 km from the source: 230 m · falling 5.1 m per km · gravel, occasional floodplain 87 km from the source: 235 m · falling 4 m per km · gravel, occasional floodplain 88 km from the source: 231 m · falling 3.9 m per km · gravel, occasional floodplain 89 km from the source: 223 m · falling 3.1 m per km · gravel, occasional floodplain 90 km from the source: 224 m · falling 2.9 m per km · gravel, occasional floodplain 91 km from the source: 222 m · falling 3.3 m per km · gravel, occasional floodplain 92 km from the source: 215 m · falling 2.7 m per km · gravel, occasional floodplain 93 km from the source: 216 m · falling 2.3 m per km · gravel, occasional floodplain 94 km from the source: 209 m · falling 2.4 m per km · gravel, occasional floodplain 95 km from the source: 206 m · falling 1.9 m per km · gravel, occasional floodplain 96 km from the source: 215 m · falling 2.1 m per km · gravel, occasional floodplain 97 km from the source: 208 m · falling 2.8 m per km · gravel, occasional floodplain 98 km from the source: 201 m · falling 2.6 m per km · gravel, discontinuous floodplain 99 km from the source: 202 m · falling 2.7 m per km · gravel, discontinuous floodplain 100 km from the source: 194 m · falling 2.4 m per km · gravel, discontinuous floodplain 101 km from the source: 193 m · falling 1.4 m per km · gravel, discontinuous floodplain 102 km from the source: 196 m · falling 1 m per km · gravel, discontinuous floodplain 103 km from the source: 192 m · falling 0.8 m per km · gravel, discontinuous floodplain 104 km from the source: 195 m · falling 0.6 m per km · gravel, discontinuous floodplain 105 km from the source: 192 m · falling 0.9 m per km · gravel, discontinuous floodplain 106 km from the source: 190 m · falling 0.8 m per km · gravel, discontinuous floodplain 107 km from the source: 191 m · falling 0.9 m per km · gravel, discontinuous floodplain 108 km from the source: 190 m · falling 0.9 m per km · gravel, discontinuous floodplain 109 km from the source: 188 m · falling 0.8 m per km · gravel, discontinuous floodplain 110 km from the source: 191 m · falling 0.7 m per km · gravel, discontinuous floodplain 111 km from the source: 184 m · falling 0.8 m per km · gravel, discontinuous floodplain 112 km from the source: 187 m · falling 0.6 m per km · gravel, discontinuous floodplain 113 km from the source: 184 m · falling 0.1 m per km · gravel, discontinuous floodplain 114 km from the source: 188 m · falling 0.2 m per km · gravel, discontinuous floodplain 115 km from the source: 183 m · falling 0.1 m per km · gravel, discontinuous floodplain 116 km from the source: 184 m · falling 0.1 m per km · gravel, discontinuous floodplain 117 km from the source: 193 m · falling 0.5 m per km · gravel, discontinuous floodplain 118 km from the source: 183 m · falling 1.1 m per km · gravel, discontinuous floodplain 119 km from the source: 181 m · falling 0.9 m per km · gravel, discontinuous floodplain 120 km from the source: 184 m · falling 1.2 m per km · gravel, discontinuous floodplain 121 km from the source: 181 m · falling 1.5 m per km · gravel, discontinuous floodplain 122 km from the source: 181 m · falling 1.1 m per km · gravel, discontinuous floodplain 123 km from the source: 180 m · falling 1.5 m per km · gravel, discontinuous floodplain 124 km from the source: 176 m · falling 1.8 m per km · gravel, discontinuous floodplain 125 km from the source: 176 m · falling 1.8 m per km · gravel, discontinuous floodplain 126 km from the source: 175 m · falling 1.8 m per km · gravel, discontinuous floodplain 127 km from the source: 171 m · falling 1.8 m per km · gravel, discontinuous floodplain 128 km from the source: 167 m · falling 1.6 m per km · gravel, discontinuous floodplain 129 km from the source: 168 m · falling 1.3 m per km · gravel, discontinuous floodplain 130 km from the source: 170 m · falling 1.4 m per km · gravel, discontinuous floodplain 131 km from the source: 167 m · falling 1.5 m per km · gravel, discontinuous floodplain 132 km from the source: 162 m · falling 1.1 m per km · gravel, discontinuous floodplain 133 km from the source: 164 m · falling 1.2 m per km · gravel, discontinuous floodplain 134 km from the source: 161 m · falling 1.1 m per km · gravel, discontinuous floodplain 135 km from the source: 158 m · falling 0.7 m per km · gravel, discontinuous floodplain 136 km from the source: 166 m · falling 0.7 m per km · gravel, discontinuous floodplain 137 km from the source: 158 m · falling 1.1 m per km · gravel, discontinuous floodplain 138 km from the source: 160 m · falling 1.2 m per km · gravel, discontinuous floodplain 139 km from the source: 158 m · falling 1.4 m per km · gravel, discontinuous floodplain 140 km from the source: 157 m · falling 1.8 m per km · gravel, occasional floodplain 141 km from the source: 154 m · falling 1.7 m per km · gravel, occasional floodplain 142 km from the source: 152 m · falling 1.6 m per km · gravel, occasional floodplain 143 km from the source: 151 m · falling 1.3 m per km · gravel, occasional floodplain 144 km from the source: 148 m · falling 0.8 m per km · gravel, occasional floodplain 145 km from the source: 148 m · falling 0.6 m per km · gravel, occasional floodplain 146 km from the source: 150 m · falling 0.6 m per km · gravel, occasional floodplain 147 km from the source: 149 m · falling 0.7 m per km · gravel, occasional floodplain 148 km from the source: 150 m · falling 1.1 m per km · bedrock, gorge 149 km from the source: 143 m · falling 1.2 m per km · bedrock, gorge 150 km from the source: 145 m · falling 1.2 m per km · bedrock, gorge 151 km from the source: 145 m · falling 1.2 m per km · bedrock, gorge 152 km from the source: 141 m · falling 1.2 m per km · bedrock, gorge 153 km from the source: 142 m · falling 1.1 m per km · bedrock, gorge 154 km from the source: 141 m · falling 1.7 m per km · bedrock, gorge 155 km from the source: 140 m · falling 1.9 m per km · bedrock, gorge 156 km from the source: 137 m · falling 1.5 m per km · bedrock, gorge 157 km from the source: 133 m · falling 1.6 m per km · bedrock, gorge 158 km from the source: 129 m · falling 1.1 m per km · bedrock, gorge 159 km from the source: 131 m · falling 0.5 m per km · bedrock, gorge 160 km from the source: 140 m · falling 0.6 m per km · bedrock, gorge 161 km from the source: 128 m · falling 0.8 m per km · bedrock, gorge 162 km from the source: 131 m · falling 0.8 m per km · bedrock, gorge 163 km from the source: 131 m · falling 1.1 m per km · bedrock, gorge 164 km from the source: 127 m · falling 1 m per km · bedrock, gorge 165 km from the source: 127 m · falling 0.5 m per km · bedrock, gorge 166 km from the source: 127 m · falling 0.7 m per km · bedrock, gorge 167 km from the source: 127 m · falling 1 m per km · bedrock, gorge 168 km from the source: 128 m · falling 1.1 m per km · bedrock, gorge 169 km from the source: 125 m · falling 1.4 m per km · bedrock, gorge 170 km from the source: 121 m · falling 1.4 m per km · bedrock, gorge 171 km from the source: 118 m · falling 1.2 m per km · bedrock, gorge 172 km from the source: 122 m · falling 0.8 m per km · bedrock, gorge 173 km from the source: 120 m · falling 0.5 m per km · bedrock, gorge 174 km from the source: 121 m · falling 0.4 m per km · bedrock, gorge 175 km from the source: 117 m · falling 0.2 m per km · bedrock, gorge 0 km 44 km 88 km 131 km 175 km
bedrock · 47% gravel · 50% fine-grained · 3% not surveyed · 1%
Headwater
1411 m
Outlet
117 m
Typical drop
7.4 m/km
Steepest sampled stretch
48.9 m/km, near 13 km
Hover the profile for the reading at any kilometre.
Source: Geoscience Australia.
Source details and licence

Geoscience Australia — 1 second SRTM-derived DEM-H v1.0 (NCI tile store). Geoscience Australia, 1 second SRTM-derived DEM-H v1.0, © Commonwealth of Australia, CC BY 4.0. retrieved 2026-08-16.

Bed material: NSW Department of Climate Change, Energy, the Environment and Water (Water, Surface Water Science).
Source details and licence

NSW River Styles spatial dataset — geomorphic character and dominant bed material. NSW River Styles spatial dataset, © State Government of NSW and NSW Department of Climate Change, Energy, the Environment and Water 2023. retrieved 2026-08-21.

Gauge pins identify the monitoring stations. The slope shows how steeply the river falls; it does not show rapids or safe wading routes.

The banks, seen from space

Land cover in the 120 m beside the water, Landsat 2023 to 2024 to 2025

0 to 10 km: woody dense 35% 0 to 10 km: woody open 20.6% 0 to 10 km: herbaceous native 4.1% 0 to 10 km: cultivated 40.3% 10 to 20 km: woody dense 97.2% 10 to 20 km: woody open 1.9% 10 to 20 km: herbaceous native 0.3% 10 to 20 km: cultivated 0.6% 20 to 30 km: woody dense 76.5% 20 to 30 km: woody open 21.3% 20 to 30 km: herbaceous native 1.6% 20 to 30 km: cultivated 0.6% 30 to 40 km: woody dense 76.9% 30 to 40 km: woody open 14.1% 30 to 40 km: herbaceous native 0.9% 30 to 40 km: cultivated 8.1% 40 to 50 km: woody dense 85.1% 40 to 50 km: woody open 11.4% 40 to 50 km: herbaceous native 0.3% 40 to 50 km: cultivated 3.2% 50 to 60 km: woody dense 85.9% 50 to 60 km: woody open 11.8% 50 to 60 km: woody sparse 1% 50 to 60 km: herbaceous native 0.3% 50 to 60 km: cultivated 1% 60 to 70 km: woody dense 82.3% 60 to 70 km: woody open 15.3% 60 to 70 km: woody sparse 1.7% 60 to 70 km: herbaceous native 0.7% 70 to 80 km: woody dense 76.1% 70 to 80 km: woody open 16.4% 70 to 80 km: woody sparse 7.5% 80 to 90 km: woody dense 75.4% 80 to 90 km: woody open 20.8% 80 to 90 km: woody sparse 2.4% 80 to 90 km: herbaceous native 1.4% 90 to 100 km: woody dense 74.8% 90 to 100 km: woody open 20.4% 90 to 100 km: woody sparse 2% 90 to 100 km: herbaceous native 2.4% 90 to 100 km: cultivated 0.4% 100 to 110 km: woody dense 49.5% 100 to 110 km: woody open 21.8% 100 to 110 km: woody sparse 1.3% 100 to 110 km: herbaceous native 17.5% 100 to 110 km: cultivated 9.9% 110 to 120 km: woody dense 36.1% 110 to 120 km: woody open 24.4% 110 to 120 km: woody sparse 0.3% 110 to 120 km: herbaceous native 16.1% 110 to 120 km: cultivated 23.1% 120 to 130 km: woody dense 50% 120 to 130 km: woody open 29.1% 120 to 130 km: woody sparse 1.1% 120 to 130 km: herbaceous native 14.4% 120 to 130 km: cultivated 5.4% 130 to 140 km: woody dense 49.4% 130 to 140 km: woody open 21.5% 130 to 140 km: woody sparse 3.1% 130 to 140 km: herbaceous native 15.6% 130 to 140 km: cultivated 10.4% 140 to 150 km: woody dense 41.2% 140 to 150 km: woody open 30.4% 140 to 150 km: woody sparse 3.7% 140 to 150 km: herbaceous native 5.6% 140 to 150 km: cultivated 18.2% 140 to 150 km: bare 0.9% 150 to 160 km: woody dense 62.6% 150 to 160 km: woody open 26.1% 150 to 160 km: woody sparse 1.3% 150 to 160 km: herbaceous native 4.3% 150 to 160 km: cultivated 5.7% 160 to 170 km: woody dense 75.5% 160 to 170 km: woody open 14.8% 160 to 170 km: woody sparse 4.6% 160 to 170 km: herbaceous native 1.9% 160 to 170 km: cultivated 3.2% 170 to 175 km: woody dense 78.3% 170 to 175 km: woody open 16.9% 170 to 175 km: woody sparse 2.4% 170 to 175 km: cultivated 2.4% 0 km 50 km 100 km 150 km
dense forest open woodland scattered trees and scrub native grass and heath farmed or cleared bare ground lake
Along the river itself about 87% of the bank is under trees, 5% is native grass or heath and 8% is farmed. The most wooded stretch is 70 to 80 km from the source; the most open is 0 to 10 km. A satellite reads the canopy, not the ground beneath it, so treat this as a read of the country, not a survey of every bank.
Source: Geoscience Australia / Digital Earth Australia.
Source details and licence

DEA Land Cover (Landsat) — Level 4 classification, continental mosaics. © Commonwealth of Australia (Geoscience Australia). DEA Land Cover (Landsat), Digital Earth Australia. retrieved 2026-08-19.

How well this water has been surveyed

26 capture records, 1 decade of 1 on file

0 10 20 30 2010s: 26 capture records 2010s
seine netting, 26 records
Capture records by decade — electrofishing, netting, trapping and rotenone surveys only; a sighting, an eDNA water sample or a stocking release is not a capture and is not counted here. A record is not an abundance estimate, and a decade with no bar is a decade with no capture survey on file, not evidence the water was empty.
Source: Atlas of Living Australia.
Source details and licence

Atlas of Living Australia — freshwater fish occurrence records (open licences, with coordinates). Occurrence records from the Atlas of Living Australia and its contributing datasets, including the Victorian Biodiversity Atlas, NSW BioNet Atlas, Sustainable Rivers Audit, Murray-Darling Basin fish monitoring programs, OZCAM museum collections and iNaturalist Australia. Each record carries its own licence and originating dataset. retrieved 2026-08-13.

Conditions

What the gauges say

Nymboida River D/s Nymboida Weir

River flow

No reading shown: No reading has been captured for this gauge yet, so none is shown.

Gauge height

No reading shown: No reading has been captured for this gauge yet, so none is shown.

Readings from the Bureau of Meteorology's Water Data Online, © Commonwealth of Australia, licensed CC BY 4.0. Nothing here is a forecast. Check the gauge before you rely on it.

Weather

What the sky is doing

Live weather for Nymboida River D/s Nymboida Weir loads here. If it does not, check the Bureau of Meteorology forecast before you go.

Weather data by Open-Meteo.com

Questions anglers ask

What should I fish for on the Nymboida?

Australian bass on a surface fly after dark is the trip to plan. Freshwater catfish on a slow, weighted fly along the bottom are a good second option on the same warm evening.

Will I hook a cod?

You might. The river holds eastern freshwater cod as well as bass, and at night you often cannot tell which of them took the fly until it is close. Read what the current NSW guide says about cod before you go, and handle anything you land with that in mind.

Is it trout water?

The upper river is listed as a general trout water: everything above the Wild Cattle Creek junction, Wild Cattle Creek itself, and the creeks feeding the river up there. Trout are not among the fish recorded in the river, so treat the listing as a rule to check rather than a reason to bring a trout rod. Check the current NSW guide for what a general trout water listing means for your dates.

Where do I get in?

The access card on this water names the places to start. They describe where the river can be reached, not permission to walk the banks beyond them; assume those are private and ask before you cross a paddock.

Behind this page