Australia Fly Guide
NSW · New England

Macintyre River

Imagery © Esri

info

Before you rely on this page

  • Access here has not been confirmed on the ground — treat every way in as unverified.

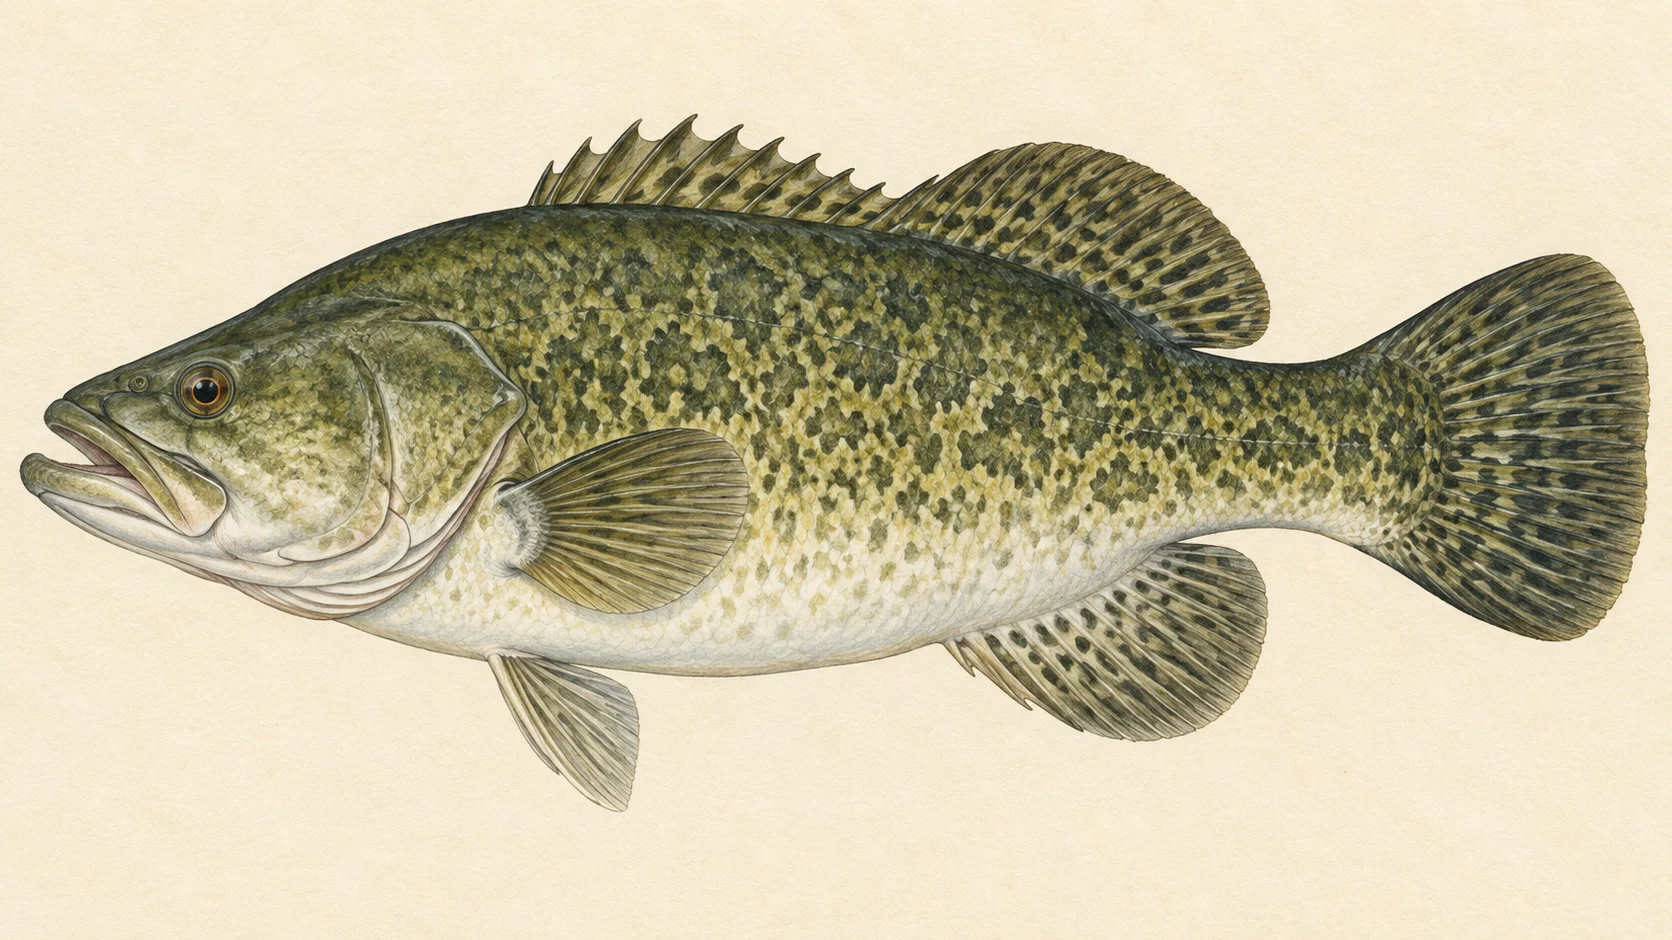
The Macintyre River is Murray cod water, and the reason to drive to it is the chance of a cod on a fly in clear water. FlyLife's writers put its headwaters, out past Armidale, in the first rank of clear-water cod fishing on a fly.

The Macintyre falls under both New South Wales and Queensland, and it carries on to join the Boomi River.

Start at one of the public sites the access card names; the card describes the sites, it does not grant you the bank either side. The river holds Murray cod and golden perch. Beyond the closure at Goondiwindi Weir, your bag, size and any closed season come from the statewide cod and perch rules, so read the current NSW guide, and the Queensland rules if you cross over, before you go. Go in the warm months with a big surface fly for cod and a sunk fly for perch.

The second trip is the headwaters, the water the magazine's writers rate so highly, and they go there for cod. Before you plan it, check the current NSW guide for the trout-waters closed season and the waters it covers.

Leave the water around Goondiwindi Weir alone: a NSW notice closes fishing by any method within 150 metres upstream and 150 metres downstream of the weir face.

Pick a site from the access card, and have a surface fly on before the light goes.

Water and habitat

The gradient profile shows how the river falls along its length, and the bank cover chart shows what grows along it. Read both before you choose a stretch: where the profile steepens you should expect faster, more broken water, and where it flattens, longer and slower pools.

Whatever the stretch, a Murray cod is an ambush fish and it lives beside cover. In our experience that means the snag, the boulder, the undercut bank and the deep shaded edge, and a cod river is best read as a string of those ambush points rather than as pools and runs. Fish each one properly before you move. Golden perch sit wider, often in the slower, deeper water off the same cover.

Clear water is the attraction and the difficulty. A fish that can see a fly from a distance can also see you, so approach every piece of water from downstream and keep your shadow off it.

Fish and forage

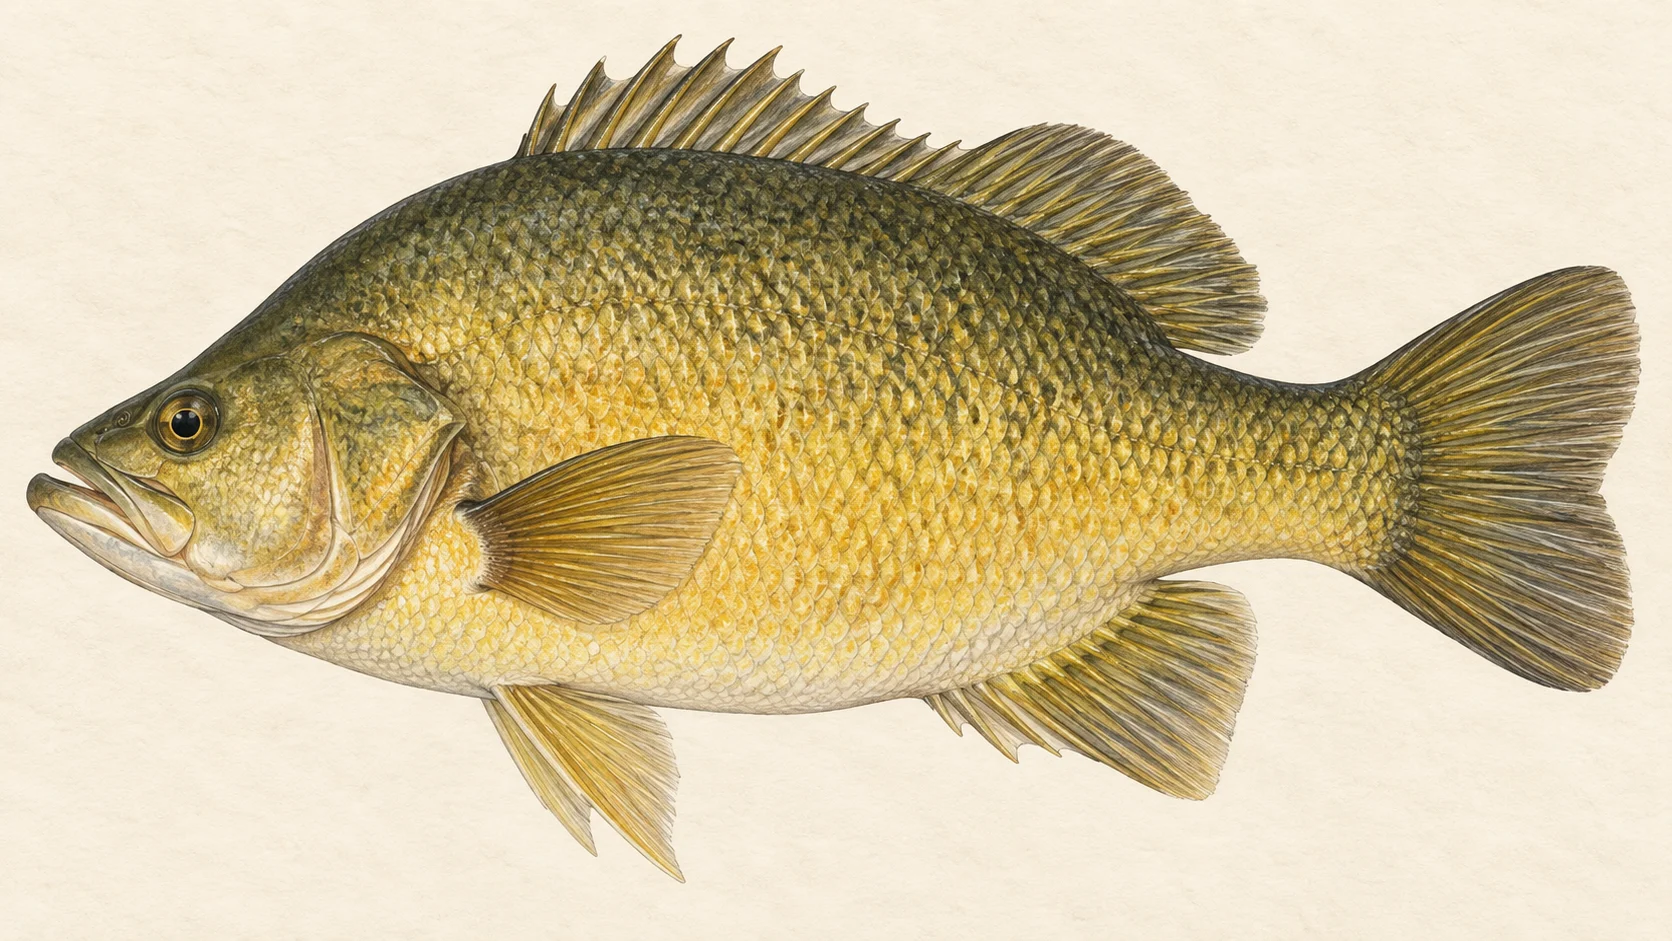
Murray cod are the headline fish, recorded with high confidence along with golden perch and freshwater catfish. Silver perch, spangled perch and bony bream are recorded with less certainty. European carp and goldfish are there as well.

The forage is small native fish: Australian smelt, carp gudgeons, firetail gudgeon, three kinds of hardyhead, Murray River rainbowfish, Agassiz's glassfish and mountain galaxias, with eastern gambusia among them. For a fly box, that argues for two things. A slim baitfish pattern in the 3 to 6 centimetre range for golden perch, and for cod a larger fly that pushes water, because a cod will eat whatever it can fit in its mouth.

Trout are not among the fish recorded in the river.

When to fish it

No season specific to the Macintyre was found, so what follows is a guide's read. The warm months, roughly December to March, are usually the best of the cod fishing on a fly, with fish willing to come up to a surface fly early and late in the day. The shoulders either side, October and November and then April, suit a sunk fly for cod and golden perch.

Cod can still be caught through the cold months, slower and deeper, on a sunk fly with long pauses. Before any trip, and especially a spring one, check both states' rules on Murray cod and whether a closed season applies. For the upper river, check the trout-waters closed season in the current NSW guide as well.

After rain, check the live conditions section before you drive. A river that is up and coloured fishes poorly for a sight-fishing angler.

How to fish it

For cod, an eight or nine weight with a floating line and a short, stout leader. A large surface fly, a gurgler or a bulky popper on a 2/0 to 4/0 hook, cast tight to cover and worked back with a pop and a long pause. Expect the take on the pause. When a fish follows and refuses, or the light is high, change to a sub-surface fly of the same size and fish it slower and deeper past the same cover.

For golden perch, drop to a six or seven weight and a weighted fly: a size 2 to 6 Woolly Bugger in black or olive, or a small baitfish pattern, crawled along the bottom off the edge of cover. Keep the leader heavy enough for a cod, because the cod will eat that fly too.

Handle every cod in the water, support its belly, grip the lower jaw, and let it go quickly.

Access and safety

The access card names the public sites on the river, drawn from the NSW angler access site layers. They are the places to start. Between them the river runs past land that is not yours to cross, so if a stretch is not on the card, find out who owns the bank and ask before you fish it.

As on any inland river, water rises fast after rain upstream, and a clear, shallow crossing in the morning can be something else by afternoon. Wade only where you can see your next step, and check the live conditions section before you set out. Carry more water than you think you need in summer, and tell someone where you are going.

Regulations

One water-specific rule was found, from New South Wales. Fishing by any method is closed on the Macintyre River and its tributaries within 150 metres upstream and 150 metres downstream of the weir face at Goondiwindi Weir, under the NSW closed-waters notices. The river is the NSW and Queensland border there, and the notice does not state Queensland's rules, so read those as well.

No other water-specific rule was found. Murray cod, golden perch and the other natives carry their own statewide rules, and the river falls under both states, so check the current NSW Department of Primary Industries and Regional Development recreational fishing guide, including the trout-waters closed season and the waters it covers, and the current Fisheries Queensland rules for size and bag limits, any closed season and the licence you need, before you fish.
8 named access sites

These authority-listed points are separate from the mapped track intersections above. Some were inspected and some are public boat-ramp records; each row says which. A listing does not grant permission across private land, so check closures, signs and gates when you arrive.

  • Baronga East Tsr Authority-listed access site · Access mode not stated · TSR
  • Boronga Tsr Authority-listed access site · Access mode not stated · TSR
  • Carbucky East Tsr Authority-listed access site · Access mode not stated · TSR
  • Carbucky Tsr Authority-listed access site · Access mode not stated · TSR
  • Lake Inverell Inspected access site · Access mode not stated · Council Reserve
  • Little Carbucky Tsr Authority-listed access site · Access mode not stated · TSR
  • Morella Lane Authority-listed access site · Access mode not stated · TSR
  • Stuartville Tsr Authority-listed access site · Access mode not stated · TSR

Sources: NSW Department of Primary Industries and Regional Development.

When things happen

The guide's calendar for this water

When things happen

The year on this water

A year at a glance; check current rules

  • Cod on the surface · Dec to Mar A guide's read, not a measured season. The warm months are usually the best of the cod fishing on a fly; a big surface fly worked slowly past cover early and late in the day. Check the current NSW guide, including the trout-waters closed season, and the Murray cod rules in both states before any trip.
  • Cod and golden perch on a sunk fly · Oct to Apr A guide's read. Through the shoulders of the season a weighted streamer fished slow and deep, a size 2 to 6 Woolly Bugger in black or olive for golden perch and something bigger on a 2/0 hook for cod.
  • Cooler-month cod · May to Aug A guide's read. Cod can still be caught in the cold, slower and deeper, on a sunk fly with long pauses. Check both states' rules on Murray cod, including any closed season, before you plan a late-winter or spring trip.

What the record shows

Flows, river gradient, changing water levels, fish surveys and stocking

What the record shows

The fall of the river

Elevation along the river, source to end

Falls 1196 m over 501.9 km, gravel bed, floodplain pockets for much of its length.

185 784 1,382 gauge 416063 gauge 416056 gauge 416057 gauge 416066 gauge 416016 gauge 416068 gauge 416010 gauge 416031 gauge 416058 gauge 416012 gauge 416002 gauge 416201A gauge 416201B gauge 416047 0 km from the source: 1382 m · falling 18.3 m per km 1.68 km from the source: 1306 m · falling 25 m per km · fine-grained, valley fill 3.36 km from the source: 1228 m · falling 27.1 m per km · bedrock, gorge 5.04 km from the source: 1184 m · falling 30 m per km · bedrock, gorge 6.71 km from the source: 1119 m · falling 32.1 m per km · gravel, occasional floodplain 8.39 km from the source: 1060 m · falling 28 m per km · gravel, occasional floodplain 10.07 km from the source: 1026 m · falling 24 m per km · gravel, occasional floodplain 11.75 km from the source: 981 m · falling 20.5 m per km · gravel, discontinuous floodplain 13.43 km from the source: 955 m · falling 16.6 m per km · gravel, discontinuous floodplain 15.11 km from the source: 934 m · falling 13.6 m per km · gravel, discontinuous floodplain 16.79 km from the source: 915 m · falling 11.4 m per km · gravel, discontinuous floodplain 18.46 km from the source: 896 m · falling 9.6 m per km · gravel, discontinuous floodplain 20.14 km from the source: 883 m · falling 8.2 m per km · gravel, discontinuous floodplain 21.82 km from the source: 872 m · falling 7.1 m per km · gravel, occasional floodplain 23.5 km from the source: 861 m · falling 6.3 m per km · gravel, occasional floodplain 25.18 km from the source: 849 m · falling 6.3 m per km · gravel, discontinuous floodplain 26.86 km from the source: 842 m · falling 7.1 m per km · gravel, discontinuous floodplain 28.54 km from the source: 837 m · falling 8.8 m per km · gravel, discontinuous floodplain 30.21 km from the source: 826 m · falling 11 m per km · gravel, discontinuous floodplain 31.89 km from the source: 796 m · falling 12.8 m per km · gravel, occasional floodplain 33.57 km from the source: 769 m · falling 13.8 m per km · gravel, occasional floodplain 35.25 km from the source: 737 m · falling 13.2 m per km · gravel, occasional floodplain 36.93 km from the source: 717 m · falling 11.8 m per km · gravel, occasional floodplain 38.61 km from the source: 702 m · falling 9.9 m per km · gravel, occasional floodplain 40.29 km from the source: 681 m · falling 8 m per km · gravel, discontinuous floodplain 41.96 km from the source: 686 m · falling 6.7 m per km · gravel, discontinuous floodplain 43.64 km from the source: 664 m · falling 5.8 m per km · gravel, discontinuous floodplain 45.32 km from the source: 656 m · falling 4.8 m per km · gravel, discontinuous floodplain 47 km from the source: 650 m · falling 3.9 m per km · gravel, discontinuous floodplain 48.68 km from the source: 644 m · falling 3.4 m per km · gravel, discontinuous floodplain 50.36 km from the source: 641 m · falling 2.7 m per km · gravel, discontinuous floodplain 52.03 km from the source: 636 m · falling 2.3 m per km · gravel, discontinuous floodplain 53.71 km from the source: 635 m · falling 2.2 m per km · gravel, discontinuous floodplain 55.39 km from the source: 628 m · falling 2.1 m per km · gravel, discontinuous floodplain 57.07 km from the source: 625 m · falling 1.9 m per km · gravel, discontinuous floodplain 58.75 km from the source: 624 m · falling 1.8 m per km · gravel, discontinuous floodplain 60.43 km from the source: 619 m · falling 1.8 m per km · gravel, discontinuous floodplain 62.11 km from the source: 617 m · falling 1.6 m per km · gravel, discontinuous floodplain 63.78 km from the source: 615 m · falling 1.5 m per km · gravel, discontinuous floodplain 65.46 km from the source: 612 m · falling 1.4 m per km · gravel, discontinuous floodplain 67.14 km from the source: 608 m · falling 1.3 m per km · gravel, discontinuous floodplain 68.82 km from the source: 607 m · falling 1.4 m per km · gravel, discontinuous floodplain 70.5 km from the source: 606 m · falling 1.5 m per km · gravel, discontinuous floodplain 72.18 km from the source: 607 m · falling 1.9 m per km · gravel, discontinuous floodplain 73.86 km from the source: 599 m · falling 2.3 m per km · water storage 75.53 km from the source: 594 m · falling 2.5 m per km · gravel, discontinuous floodplain 77.21 km from the source: 591 m · falling 2.3 m per km · gravel, discontinuous floodplain 78.89 km from the source: 586 m · falling 2.2 m per km · water storage 80.57 km from the source: 581 m · falling 1.9 m per km · gravel, discontinuous floodplain 82.25 km from the source: 578 m · falling 1.6 m per km · gravel, discontinuous floodplain 83.93 km from the source: 583 m · falling 1.6 m per km · gravel, discontinuous floodplain 85.61 km from the source: 575 m · falling 1.7 m per km · gravel, discontinuous floodplain 87.28 km from the source: 572 m · falling 1.7 m per km · gravel, discontinuous floodplain 88.96 km from the source: 568 m · falling 1.6 m per km · gravel, discontinuous floodplain 90.64 km from the source: 567 m · falling 1.5 m per km · gravel, discontinuous floodplain 92.32 km from the source: 564 m · falling 1.3 m per km · gravel, discontinuous floodplain 94 km from the source: 562 m · falling 1.2 m per km · gravel, discontinuous floodplain 95.68 km from the source: 561 m · falling 1.1 m per km · gravel, discontinuous floodplain 97.36 km from the source: 560 m · falling 1.1 m per km · gravel, discontinuous floodplain 99.03 km from the source: 555 m · falling 0.9 m per km · gravel, discontinuous floodplain 100.71 km from the source: 555 m · falling 0.9 m per km · gravel, discontinuous floodplain 102.39 km from the source: 554 m · falling 0.9 m per km · gravel, discontinuous floodplain 104.07 km from the source: 554 m · falling 0.9 m per km · gravel, discontinuous floodplain 105.75 km from the source: 555 m · falling 1 m per km · gravel, discontinuous floodplain 107.43 km from the source: 546 m · falling 1.3 m per km · fine-grained, discontinuous floodplain 109.11 km from the source: 545 m · falling 1.4 m per km · gravel, discontinuous floodplain 110.78 km from the source: 546 m · falling 1.4 m per km · gravel, discontinuous floodplain 112.46 km from the source: 548 m · falling 1.6 m per km · gravel, discontinuous floodplain 114.14 km from the source: 536 m · falling 1.6 m per km · gravel, discontinuous floodplain 115.82 km from the source: 535 m · falling 1.5 m per km · gravel, discontinuous floodplain 117.5 km from the source: 537 m · falling 1.5 m per km · gravel, discontinuous floodplain 119.18 km from the source: 531 m · falling 1.4 m per km · gravel, discontinuous floodplain 120.86 km from the source: 529 m · falling 1 m per km · gravel, discontinuous floodplain 122.53 km from the source: 528 m · falling 1 m per km · gravel, discontinuous floodplain 124.21 km from the source: 525 m · falling 0.9 m per km · gravel, discontinuous floodplain 125.89 km from the source: 527 m · falling 0.6 m per km · gravel, discontinuous floodplain 127.57 km from the source: 526 m · falling 0.8 m per km · gravel, discontinuous floodplain 129.25 km from the source: 522 m · falling 0.9 m per km · gravel, discontinuous floodplain 130.93 km from the source: 522 m · falling 1 m per km · gravel, discontinuous floodplain 132.6 km from the source: 523 m · falling 1.2 m per km · gravel, discontinuous floodplain 134.28 km from the source: 516 m · falling 1.3 m per km · gravel, discontinuous floodplain 135.96 km from the source: 515 m · falling 1.2 m per km · gravel, discontinuous floodplain 137.64 km from the source: 512 m · falling 1 m per km · gravel, discontinuous floodplain 139.32 km from the source: 513 m · falling 0.9 m per km · gravel, discontinuous floodplain 141 km from the source: 510 m · falling 0.8 m per km · gravel, discontinuous floodplain 142.68 km from the source: 510 m · falling 0.8 m per km · gravel, discontinuous floodplain 144.35 km from the source: 509 m · falling 0.8 m per km · gravel, discontinuous floodplain 146.03 km from the source: 508 m · falling 0.8 m per km · gravel, discontinuous floodplain 147.71 km from the source: 504 m · falling 0.8 m per km · gravel, discontinuous floodplain 149.39 km from the source: 503 m · falling 0.7 m per km · gravel, discontinuous floodplain 151.07 km from the source: 503 m · falling 0.7 m per km · gravel, discontinuous floodplain 152.75 km from the source: 504 m · falling 0.6 m per km · gravel, discontinuous floodplain 154.43 km from the source: 501 m · falling 0.7 m per km · gravel, discontinuous floodplain 156.1 km from the source: 498 m · falling 0.8 m per km · gravel, discontinuous floodplain 157.78 km from the source: 498 m · falling 0.8 m per km · gravel, discontinuous floodplain 159.46 km from the source: 498 m · falling 0.9 m per km · gravel, discontinuous floodplain 161.14 km from the source: 494 m · falling 0.8 m per km · gravel, discontinuous floodplain 162.82 km from the source: 494 m · falling 0.6 m per km · gravel, discontinuous floodplain 164.5 km from the source: 493 m · falling 0.6 m per km · gravel, discontinuous floodplain 166.18 km from the source: 491 m · falling 0.9 m per km · gravel, discontinuous floodplain 167.85 km from the source: 492 m · falling 1.4 m per km · gravel, discontinuous floodplain 169.53 km from the source: 493 m · falling 2.5 m per km · gravel, discontinuous floodplain 171.21 km from the source: 488 m · falling 3.5 m per km · gravel, occasional floodplain 172.89 km from the source: 475 m · falling 4.2 m per km · gravel, occasional floodplain 174.57 km from the source: 469 m · falling 4.5 m per km · gravel, occasional floodplain 176.25 km from the source: 456 m · falling 4.2 m per km · gravel, occasional floodplain 177.93 km from the source: 451 m · falling 3.6 m per km · gravel, occasional floodplain 179.6 km from the source: 446 m · falling 3 m per km · gravel, occasional floodplain 181.28 km from the source: 444 m · falling 2.7 m per km · gravel, occasional floodplain 182.96 km from the source: 443 m · falling 2.5 m per km · gravel, discontinuous floodplain 184.64 km from the source: 433 m · falling 2.4 m per km · gravel, discontinuous floodplain 186.32 km from the source: 429 m · falling 2 m per km · gravel, discontinuous floodplain 188 km from the source: 426 m · falling 1.8 m per km · gravel, discontinuous floodplain 189.68 km from the source: 425 m · falling 1.4 m per km · gravel, discontinuous floodplain 191.35 km from the source: 425 m · falling 1.2 m per km · gravel, discontinuous floodplain 193.03 km from the source: 422 m · falling 1.3 m per km · gravel, discontinuous floodplain 194.71 km from the source: 418 m · falling 1.4 m per km · gravel, discontinuous floodplain 196.39 km from the source: 420 m · falling 1.6 m per km · gravel, discontinuous floodplain 198.07 km from the source: 412 m · falling 1.7 m per km · gravel, discontinuous floodplain 199.75 km from the source: 411 m · falling 1.6 m per km · gravel, discontinuous floodplain 201.43 km from the source: 407 m · falling 1.7 m per km · gravel, discontinuous floodplain 203.1 km from the source: 406 m · falling 1.7 m per km · gravel, discontinuous floodplain 204.78 km from the source: 404 m · falling 1.8 m per km · sand, occasional floodplain 206.46 km from the source: 400 m · falling 2.2 m per km · sand, occasional floodplain 208.14 km from the source: 396 m · falling 2.6 m per km · sand, occasional floodplain 209.82 km from the source: 393 m · falling 3.1 m per km · sand, occasional floodplain 211.5 km from the source: 387 m · falling 3.4 m per km · bedrock, gorge 213.17 km from the source: 378 m · falling 4.2 m per km · bedrock, gorge 214.85 km from the source: 373 m · falling 6 m per km · bedrock, gorge 216.53 km from the source: 365 m · falling 7.7 m per km · bedrock, gorge 218.21 km from the source: 362 m · falling 9.3 m per km · bedrock, gorge 219.89 km from the source: 334 m · falling 10.3 m per km · bedrock, gorge 221.57 km from the source: 291 m · falling 9.5 m per km · bedrock, gorge 223.25 km from the source: 283 m · falling 7.4 m per km · bedrock, gorge 224.92 km from the source: 281 m · falling 5.3 m per km · bedrock, gorge 226.6 km from the source: 275 m · falling 3 m per km · gravel, discontinuous floodplain 228.28 km from the source: 275 m · falling 1.4 m per km · gravel, discontinuous floodplain 229.96 km from the source: 273 m · falling 1 m per km · gravel, discontinuous floodplain 231.64 km from the source: 272 m · falling 0.9 m per km · gravel, discontinuous floodplain 233.32 km from the source: 270 m · falling 0.8 m per km · gravel, discontinuous floodplain 235 km from the source: 269 m · falling 0.9 m per km · gravel, discontinuous floodplain 236.67 km from the source: 268 m · falling 0.9 m per km · gravel, discontinuous floodplain 238.35 km from the source: 265 m · falling 0.8 m per km · gravel, discontinuous floodplain 240.03 km from the source: 265 m · falling 0.6 m per km · gravel, discontinuous floodplain 241.71 km from the source: 262 m · falling 0.6 m per km · gravel, discontinuous floodplain 243.39 km from the source: 264 m · falling 0.5 m per km · gravel, discontinuous floodplain 245.07 km from the source: 263 m · falling 0.6 m per km · gravel, discontinuous floodplain 246.75 km from the source: 262 m · falling 0.7 m per km · gravel, discontinuous floodplain 248.42 km from the source: 258 m · falling 0.7 m per km · gravel, discontinuous floodplain 250.1 km from the source: 258 m · falling 0.6 m per km · gravel, discontinuous floodplain 251.78 km from the source: 257 m · falling 0.5 m per km · gravel, discontinuous floodplain 253.46 km from the source: 257 m · falling 0.3 m per km · gravel, discontinuous floodplain 255.14 km from the source: 257 m · falling 0.1 m per km · gravel, discontinuous floodplain 256.82 km from the source: 258 m · falling 0.2 m per km · gravel, discontinuous floodplain 258.5 km from the source: 254 m · falling 0.2 m per km · gravel 260.17 km from the source: 257 m · falling 0.2 m per km · gravel 261.85 km from the source: 258 m · falling 0.5 m per km · gravel 263.53 km from the source: 253 m · falling 0.7 m per km · gravel 265.21 km from the source: 254 m · falling 0.8 m per km · gravel 266.89 km from the source: 252 m · falling 0.9 m per km · gravel 268.57 km from the source: 249 m · falling 0.9 m per km · gravel 270.25 km from the source: 249 m · falling 0.8 m per km · gravel 271.92 km from the source: 248 m · falling 0.8 m per km · gravel 273.6 km from the source: 246 m · falling 0.7 m per km · gravel 275.28 km from the source: 243 m · falling 0.6 m per km · gravel 276.96 km from the source: 244 m · falling 0.6 m per km · gravel 278.64 km from the source: 245 m · falling 0.6 m per km · gravel 280.32 km from the source: 242 m · falling 0.7 m per km · gravel 282 km from the source: 240 m · falling 0.8 m per km · gravel 283.67 km from the source: 240 m · falling 0.8 m per km · gravel 285.35 km from the source: 239 m · falling 0.8 m per km · gravel 287.03 km from the source: 235 m · falling 0.6 m per km · gravel 288.71 km from the source: 234 m · falling 0.4 m per km · gravel 290.39 km from the source: 237 m · falling 0.3 m per km · gravel 292.07 km from the source: 234 m · falling 0.1 m per km · gravel 293.75 km from the source: 236 m · falling 0.1 m per km · gravel 295.42 km from the source: 234 m · falling 0.3 m per km · gravel 297.1 km from the source: 235 m · falling 0.5 m per km · gravel 298.78 km from the source: 234 m · falling 0.7 m per km · gravel 300.46 km from the source: 233 m · falling 0.8 m per km · gravel 302.14 km from the source: 230 m · falling 0.7 m per km · gravel 303.82 km from the source: 227 m · falling 0.6 m per km · gravel 305.49 km from the source: 228 m · falling 0.3 m per km · gravel 307.17 km from the source: 229 m · falling 0 m per km · gravel 308.85 km from the source: 228 m · falling 0 m per km · gravel 310.53 km from the source: 229 m · falling -0.1 m per km · gravel 312.21 km from the source: 228 m · falling -0.1 m per km · gravel 313.89 km from the source: 232 m · falling 0 m per km · gravel 315.57 km from the source: 227 m · falling 0.1 m per km · gravel 317.24 km from the source: 230 m · falling 0.2 m per km · gravel 318.92 km from the source: 230 m · falling 0.4 m per km · gravel 320.6 km from the source: 227 m · falling 0.7 m per km · gravel 322.28 km from the source: 225 m · falling 0.7 m per km · gravel 323.96 km from the source: 226 m · falling 0.7 m per km · gravel 325.64 km from the source: 223 m · falling 0.6 m per km · gravel 327.32 km from the source: 221 m · falling 0.4 m per km · gravel 328.99 km from the source: 221 m · falling 0.2 m per km · gravel 330.67 km from the source: 223 m · falling 0.1 m per km · gravel 332.35 km from the source: 223 m · falling 0.1 m per km · sand 334.03 km from the source: 222 m · falling 0.1 m per km · sand 335.71 km from the source: 221 m · falling 0.2 m per km · sand 337.39 km from the source: 222 m · falling 0.3 m per km · sand 339.07 km from the source: 222 m · falling 0.3 m per km · sand 340.74 km from the source: 219 m · falling 0.3 m per km · sand 342.42 km from the source: 220 m · falling 0.3 m per km · sand 344.1 km from the source: 219 m · falling 0.4 m per km · sand 345.78 km from the source: 222 m · falling 0.4 m per km · sand 347.46 km from the source: 217 m · falling 0.3 m per km · sand 349.14 km from the source: 216 m · falling 0.2 m per km · sand 350.82 km from the source: 217 m · falling 0.1 m per km · sand 352.49 km from the source: 218 m · falling 0 m per km · sand 354.17 km from the source: 218 m · falling -0.1 m per km · sand 355.85 km from the source: 219 m · falling 0.1 m per km · sand 357.53 km from the source: 217 m · falling 0.3 m per km · sand 359.21 km from the source: 218 m · falling 0.4 m per km · sand 360.89 km from the source: 217 m · falling 0.4 m per km · sand 362.57 km from the source: 214 m · falling 0.3 m per km · sand 364.24 km from the source: 214 m · falling 0.1 m per km · sand 365.92 km from the source: 214 m · falling -0.1 m per km · sand 367.6 km from the source: 216 m · falling -0.1 m per km · sand 369.28 km from the source: 216 m · falling 0 m per km · sand 370.96 km from the source: 216 m · falling 0 m per km · sand 372.64 km from the source: 218 m · falling 0.2 m per km · sand 374.32 km from the source: 214 m · falling 0.4 m per km · sand 375.99 km from the source: 211 m · falling 0.3 m per km · sand 377.67 km from the source: 215 m · falling 0.2 m per km · sand 379.35 km from the source: 214 m · falling 0.3 m per km · sand 381.03 km from the source: 211 m · falling 0.2 m per km · sand 382.71 km from the source: 214 m · falling 0.2 m per km · sand 384.39 km from the source: 212 m · falling 0.3 m per km · fine-grained 386.06 km from the source: 213 m · falling 0.4 m per km · fine-grained 387.74 km from the source: 209 m · falling 0.3 m per km · fine-grained 389.42 km from the source: 209 m · falling 0.3 m per km · fine-grained 391.1 km from the source: 211 m · falling 0.2 m per km · fine-grained 392.78 km from the source: 208 m · falling 0.2 m per km · fine-grained 394.46 km from the source: 210 m · falling 0 m per km · fine-grained 396.14 km from the source: 208 m · falling 0.2 m per km · fine-grained 397.81 km from the source: 211 m · falling 0.2 m per km · fine-grained 399.49 km from the source: 207 m · falling 0.2 m per km · fine-grained 401.17 km from the source: 211 m · falling 0.3 m per km · fine-grained 402.85 km from the source: 204 m · falling 0.2 m per km · fine-grained 404.53 km from the source: 208 m · falling 0.2 m per km · fine-grained 406.21 km from the source: 209 m · falling 0.2 m per km · fine-grained 407.89 km from the source: 206 m · falling 0.2 m per km · fine-grained 409.56 km from the source: 207 m · falling 0.2 m per km · fine-grained 411.24 km from the source: 204 m · falling 0.4 m per km · fine-grained 412.92 km from the source: 205 m · falling 0.3 m per km · fine-grained 414.6 km from the source: 207 m · falling 0.3 m per km · fine-grained 416.28 km from the source: 203 m · falling 0.3 m per km · fine-grained 417.96 km from the source: 203 m · falling 0.2 m per km · fine-grained 419.64 km from the source: 203 m · falling 0.3 m per km · fine-grained 421.31 km from the source: 203 m · falling 0.3 m per km · fine-grained 422.99 km from the source: 205 m · falling 0.3 m per km · fine-grained 424.67 km from the source: 200 m · falling 0.4 m per km · fine-grained 426.35 km from the source: 200 m · falling 0.4 m per km · fine-grained 428.03 km from the source: 200 m · falling 0.3 m per km · fine-grained 429.71 km from the source: 201 m · falling 0.3 m per km · fine-grained 431.39 km from the source: 200 m · falling 0.3 m per km · fine-grained 433.06 km from the source: 198 m · falling 0.3 m per km · fine-grained 434.74 km from the source: 198 m · falling 0.3 m per km · fine-grained 436.42 km from the source: 200 m · falling 0.3 m per km · fine-grained 438.1 km from the source: 197 m · falling 0.3 m per km · fine-grained 439.78 km from the source: 197 m · falling 0.2 m per km · fine-grained 441.46 km from the source: 197 m · falling 0.2 m per km · fine-grained 443.14 km from the source: 196 m · falling 0.3 m per km · fine-grained 444.81 km from the source: 196 m · falling 0.2 m per km · fine-grained 446.49 km from the source: 196 m · falling 0.2 m per km · fine-grained 448.17 km from the source: 196 m · falling 0.1 m per km · fine-grained 449.85 km from the source: 194 m · falling 0.1 m per km · fine-grained 451.53 km from the source: 195 m · falling 0.1 m per km · fine-grained 453.21 km from the source: 194 m · falling 0.1 m per km · fine-grained 454.89 km from the source: 198 m · falling 0.3 m per km · fine-grained 456.56 km from the source: 193 m · falling 0.4 m per km · fine-grained 458.24 km from the source: 193 m · falling 0.4 m per km · fine-grained 459.92 km from the source: 194 m · falling 0.5 m per km · fine-grained 461.6 km from the source: 190 m · falling 0.5 m per km · fine-grained 463.28 km from the source: 193 m · falling 0.3 m per km · fine-grained 464.96 km from the source: 190 m · falling 0.3 m per km · fine-grained 466.63 km from the source: 190 m · falling 0.3 m per km · fine-grained 468.31 km from the source: 190 m · falling 0.2 m per km · fine-grained 469.99 km from the source: 189 m · falling 0.1 m per km · fine-grained 471.67 km from the source: 189 m · falling 0 m per km · fine-grained 473.35 km from the source: 189 m · falling 0 m per km · fine-grained 475.03 km from the source: 189 m · falling 0 m per km · fine-grained 476.71 km from the source: 190 m · falling 0.1 m per km · fine-grained 478.38 km from the source: 189 m · falling 0.2 m per km · fine-grained 480.06 km from the source: 189 m · falling 0.3 m per km · fine-grained 481.74 km from the source: 190 m · falling 0.4 m per km · fine-grained 483.42 km from the source: 186 m · falling 0.2 m per km · fine-grained 485.1 km from the source: 187 m · falling 0.1 m per km · fine-grained 486.78 km from the source: 186 m · falling 0 m per km · fine-grained 488.46 km from the source: 185 m · falling -0.1 m per km · fine-grained 490.13 km from the source: 192 m · falling 0 m per km · fine-grained 491.81 km from the source: 185 m · falling 0.2 m per km · fine-grained 493.49 km from the source: 187 m · falling 0.2 m per km · fine-grained 495.17 km from the source: 186 m · falling 0.2 m per km · fine-grained 496.85 km from the source: 185 m · falling 0.2 m per km · fine-grained 498.53 km from the source: 185 m · falling 0 m per km · fine-grained 500.21 km from the source: 186 m · falling 0 m per km · fine-grained 501.88 km from the source: 186 m · falling 0 m per km · fine-grained 0 km 125 km 251 km 376 km 502 km
bedrock · 4% gravel · 59% sand · 12% fine-grained · 24% unstated · 1% not surveyed · 0%
Headwater
1382 m
Outlet
186 m
Typical drop
2.4 m/km
Steepest sampled stretch
32.1 m/km, near 6.71 km
Hover the profile for the reading at any kilometre.
Source: Geoscience Australia.
Source details and licence

Geoscience Australia — 1 second SRTM-derived DEM-H v1.0 (NCI tile store). Geoscience Australia, 1 second SRTM-derived DEM-H v1.0, © Commonwealth of Australia, CC BY 4.0. retrieved 2026-08-16.

Bed material: NSW Department of Climate Change, Energy, the Environment and Water (Water, Surface Water Science).
Source details and licence

NSW River Styles spatial dataset — geomorphic character and dominant bed material. NSW River Styles spatial dataset, © State Government of NSW and NSW Department of Climate Change, Energy, the Environment and Water 2023. retrieved 2026-08-21.

Gauge pins identify the monitoring stations. The slope shows how steeply the river falls; it does not show rapids or safe wading routes.

The banks, seen from space

Land cover in the 120 m beside the water, Landsat 2023 to 2024 to 2025

0 to 50 km: woody dense 2.6% 0 to 50 km: woody open 62.5% 0 to 50 km: woody sparse 1.7% 0 to 50 km: herbaceous native 20.8% 0 to 50 km: cultivated 12.4% 50 to 100 km: woody dense 0.3% 50 to 100 km: woody open 33.6% 50 to 100 km: woody sparse 3.7% 50 to 100 km: herbaceous native 39.2% 50 to 100 km: cultivated 22.2% 50 to 100 km: artificial 1% 100 to 150 km: woody dense 0.1% 100 to 150 km: woody open 30.6% 100 to 150 km: woody sparse 4.2% 100 to 150 km: herbaceous native 38.1% 100 to 150 km: cultivated 26.7% 100 to 150 km: bare 0.3% 150 to 200 km: woody open 49.6% 150 to 200 km: woody sparse 7.8% 150 to 200 km: herbaceous native 33.8% 150 to 200 km: cultivated 8.7% 150 to 200 km: bare 0.1% 200 to 250 km: woody dense 0.2% 200 to 250 km: woody open 69.3% 200 to 250 km: woody sparse 6.3% 200 to 250 km: herbaceous native 22.3% 200 to 250 km: cultivated 1.4% 200 to 250 km: bare 0.5% 250 to 300 km: woody dense 0.9% 250 to 300 km: woody open 47.9% 250 to 300 km: woody sparse 4.8% 250 to 300 km: herbaceous native 34.4% 250 to 300 km: cultivated 8.3% 250 to 300 km: bare 3.7% 300 to 350 km: woody dense 15.7% 300 to 350 km: woody open 57.6% 300 to 350 km: woody sparse 2% 300 to 350 km: herbaceous native 12.8% 300 to 350 km: cultivated 11.2% 300 to 350 km: bare 0.7% 350 to 400 km: woody dense 7.9% 350 to 400 km: woody open 58.3% 350 to 400 km: woody sparse 1.9% 350 to 400 km: herbaceous native 20.6% 350 to 400 km: cultivated 10.6% 350 to 400 km: bare 0.1% 350 to 400 km: artificial 0.6% 400 to 450 km: woody dense 0.8% 400 to 450 km: woody open 80.9% 400 to 450 km: woody sparse 6.2% 400 to 450 km: herbaceous native 11.4% 400 to 450 km: cultivated 0.6% 400 to 450 km: bare 0.1% 450 to 500 km: woody open 67.1% 450 to 500 km: woody sparse 13.7% 450 to 500 km: herbaceous native 16.5% 450 to 500 km: cultivated 1.9% 450 to 500 km: bare 0.8% 500 to 503 km: woody open 36.6% 500 to 503 km: woody sparse 33.9% 500 to 503 km: herbaceous native 28.6% 500 to 503 km: cultivated 0.9% 0 km 50 km 100 km 150 km 200 km 250 km 300 km 350 km 400 km 450 km 500 km
dense forest open woodland scattered trees and scrub native grass and heath farmed or cleared bare ground lake
Along the river itself about 64% of the bank is under trees, 25% is native grass or heath and 10% is farmed. The most wooded stretch is 400 to 450 km from the source; the most open is 100 to 150 km. A satellite reads the canopy, not the ground beneath it, so treat this as a read of the country, not a survey of every bank.
Source: Geoscience Australia / Digital Earth Australia.
Source details and licence

DEA Land Cover (Landsat) — Level 4 classification, continental mosaics. © Commonwealth of Australia (Geoscience Australia). DEA Land Cover (Landsat), Digital Earth Australia. retrieved 2026-08-19.

How well this water has been surveyed

122 capture records, 3 decades of 3 on file

0 20 40 60 80 100 2000s: 13 capture records 2000s: 7 capture records 2000s: 2 capture records 2010s: 35 capture records 2010s: 1 capture record 2010s: 59 capture records 2010s: 3 capture records 2020s: 2 capture records 2000s 2010s 2020s
electrofishing (boat), 48 records electrofishing (backpack), 8 records seine netting, 61 records trapping, 5 records
Capture records by decade — electrofishing, netting, trapping and rotenone surveys only; a sighting, an eDNA water sample or a stocking release is not a capture and is not counted here. A record is not an abundance estimate, and a decade with no bar is a decade with no capture survey on file, not evidence the water was empty.
Source: Atlas of Living Australia.
Source details and licence

Atlas of Living Australia — freshwater fish occurrence records (open licences, with coordinates). Occurrence records from the Atlas of Living Australia and its contributing datasets, including the Victorian Biodiversity Atlas, NSW BioNet Atlas, Sustainable Rivers Audit, Murray-Darling Basin fish monitoring programs, OZCAM museum collections and iNaturalist Australia. Each record carries its own licence and originating dataset. retrieved 2026-08-13.

Conditions

What the gauges say

Macintyre River at Boggabilla

River flow

No reading shown: No reading has been captured for this gauge yet, so none is shown.

Gauge height

No reading shown: No reading has been captured for this gauge yet, so none is shown.

Macintyre River at Wallangra

River flow

No reading shown: No reading has been captured for this gauge yet, so none is shown.

Gauge height

No reading shown: No reading has been captured for this gauge yet, so none is shown.

Macintyre River at Holdfast (Yelarbon Crossing)

River flow

No reading shown: No reading has been captured for this gauge yet, so none is shown.

Gauge height

No reading shown: No reading has been captured for this gauge yet, so none is shown.

Water temperature

No reading shown: No reading has been captured for this gauge yet, so none is shown.

Macintyre River at Inverell (Middle Creek)

River flow

No reading shown: No reading has been captured for this gauge yet, so none is shown.

Gauge height

No reading shown: No reading has been captured for this gauge yet, so none is shown.

Water temperature

No reading shown: No reading has been captured for this gauge yet, so none is shown.

Macintyre River at Ridgelands

River flow

No reading shown: No reading has been captured for this gauge yet, so none is shown.

Gauge height

No reading shown: No reading has been captured for this gauge yet, so none is shown.

Macintyre River at Terrewah

River flow

No reading shown: No reading has been captured for this gauge yet, so none is shown.

Gauge height

No reading shown: No reading has been captured for this gauge yet, so none is shown.

Water temperature

No reading shown: No reading has been captured for this gauge yet, so none is shown.

Macintyre at Little Valley

River flow

No reading shown: No reading has been captured for this gauge yet, so none is shown.

Gauge height

No reading shown: No reading has been captured for this gauge yet, so none is shown.

Macintyre River at Elsmore Bridge

River flow

No reading shown: No reading has been captured for this gauge yet, so none is shown.

Gauge height

No reading shown: No reading has been captured for this gauge yet, so none is shown.

Macintyre River at Yetman Bridge

River flow

No reading shown: No reading has been captured for this gauge yet, so none is shown.

Gauge height

No reading shown: No reading has been captured for this gauge yet, so none is shown.

Macintyre River at Wyoming

River flow

No reading shown: No reading has been captured for this gauge yet, so none is shown.

Gauge height

No reading shown: No reading has been captured for this gauge yet, so none is shown.

Macintyre River at Riverstone

River flow

No reading shown: No reading has been captured for this gauge yet, so none is shown.

Gauge height

No reading shown: No reading has been captured for this gauge yet, so none is shown.

Macintyre River at Tintot

River flow

No reading shown: No reading has been captured for this gauge yet, so none is shown.

Gauge height

No reading shown: No reading has been captured for this gauge yet, so none is shown.

Macintyre River at Goondiwindi

River flow

No reading shown: No reading has been captured for this gauge yet, so none is shown.

Gauge height

No reading shown: No reading has been captured for this gauge yet, so none is shown.

Macintyre River at Goondiwindi Weir

River flow

No reading shown: No reading has been captured for this gauge yet, so none is shown.

Gauge height

No reading shown: No reading has been captured for this gauge yet, so none is shown.

Readings from the Bureau of Meteorology's Water Data Online, © Commonwealth of Australia, licensed CC BY 4.0. Nothing here is a forecast. Check the gauge before you rely on it.

Weather

What the sky is doing

Live weather for Macintyre River at Yetman Bridge loads here. If it does not, check the Bureau of Meteorology forecast before you go.

Weather data by Open-Meteo.com

Questions anglers ask

Where should I start?

At one of the public sites the access card names. The river holds both Murray cod and golden perch. Go in the warm months with a surface fly for cod and a sunk fly for perch.

Does the trout closed season matter on a cod river?

Check the current NSW recreational fishing guide, which sets out the trout-waters closed season and the waters it covers, before you fish the upper river. Trout are not among the fish recorded in the river.

Can I fish at Goondiwindi Weir?

Not near the weir face. A NSW notice closes fishing by any method on the Macintyre and its tributaries within 150 metres upstream and 150 metres downstream of the weir face at Goondiwindi Weir. The river is the state border there, so read the Queensland rules as well.

Which state's rules apply?

The river falls under both New South Wales and Queensland. No rule specific to the river was found beyond the NSW closure at Goondiwindi Weir, so read the current NSW Department of Primary Industries and Regional Development guide and the current Fisheries Queensland rules before you fish, and carry whichever licence the water you stand on needs.

Behind this page