Australia Fly Guide
NSW · Namoi River

Namoi River

Imagery © Esri

info

Before you rely on this page

  • Access here has not been confirmed on the ground — treat every way in as unverified.

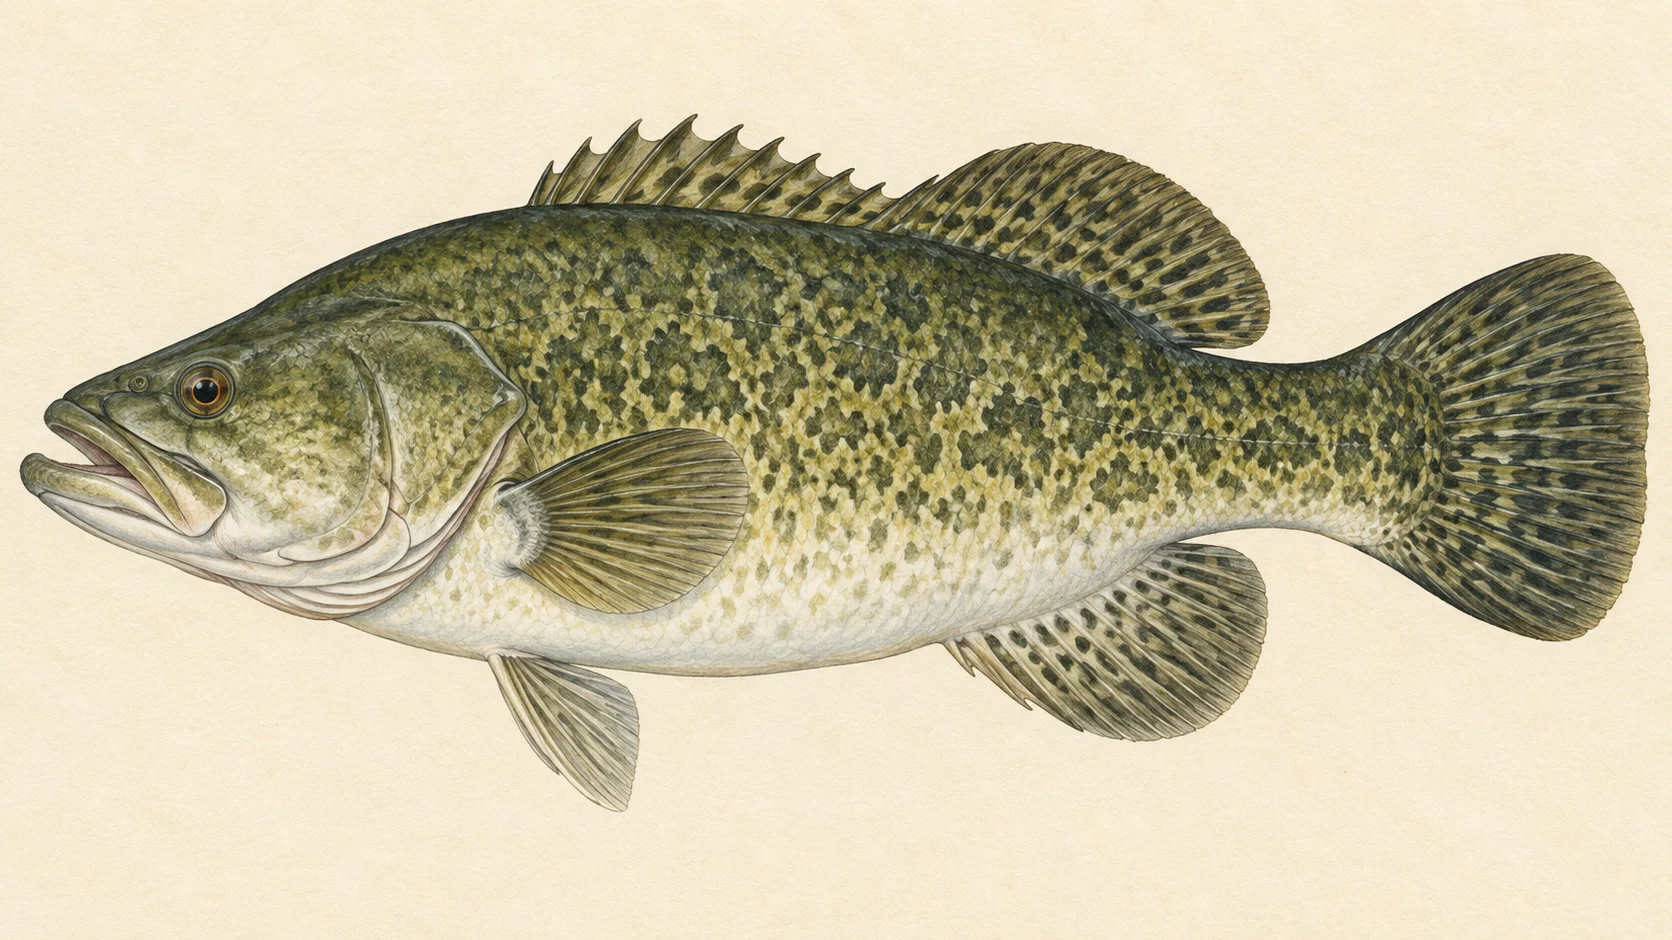
The Namoi is a native-fish river in northern New South Wales, and the reason to drive to it is a Murray cod you can see before you cast. FlyLife's writers describe sight-casting surface flies to cruising cod in shin-deep, clear water through a gorge in Warrabah National Park.

The river comes in two parts. One is the gorge, a walking water of boulders and rock pools. Away from the gorge it has weirs, including one at Manilla and another at Lake Keepit, and it runs on to join the Barwon.

That gives you two trips, and the easier one is the weir water.

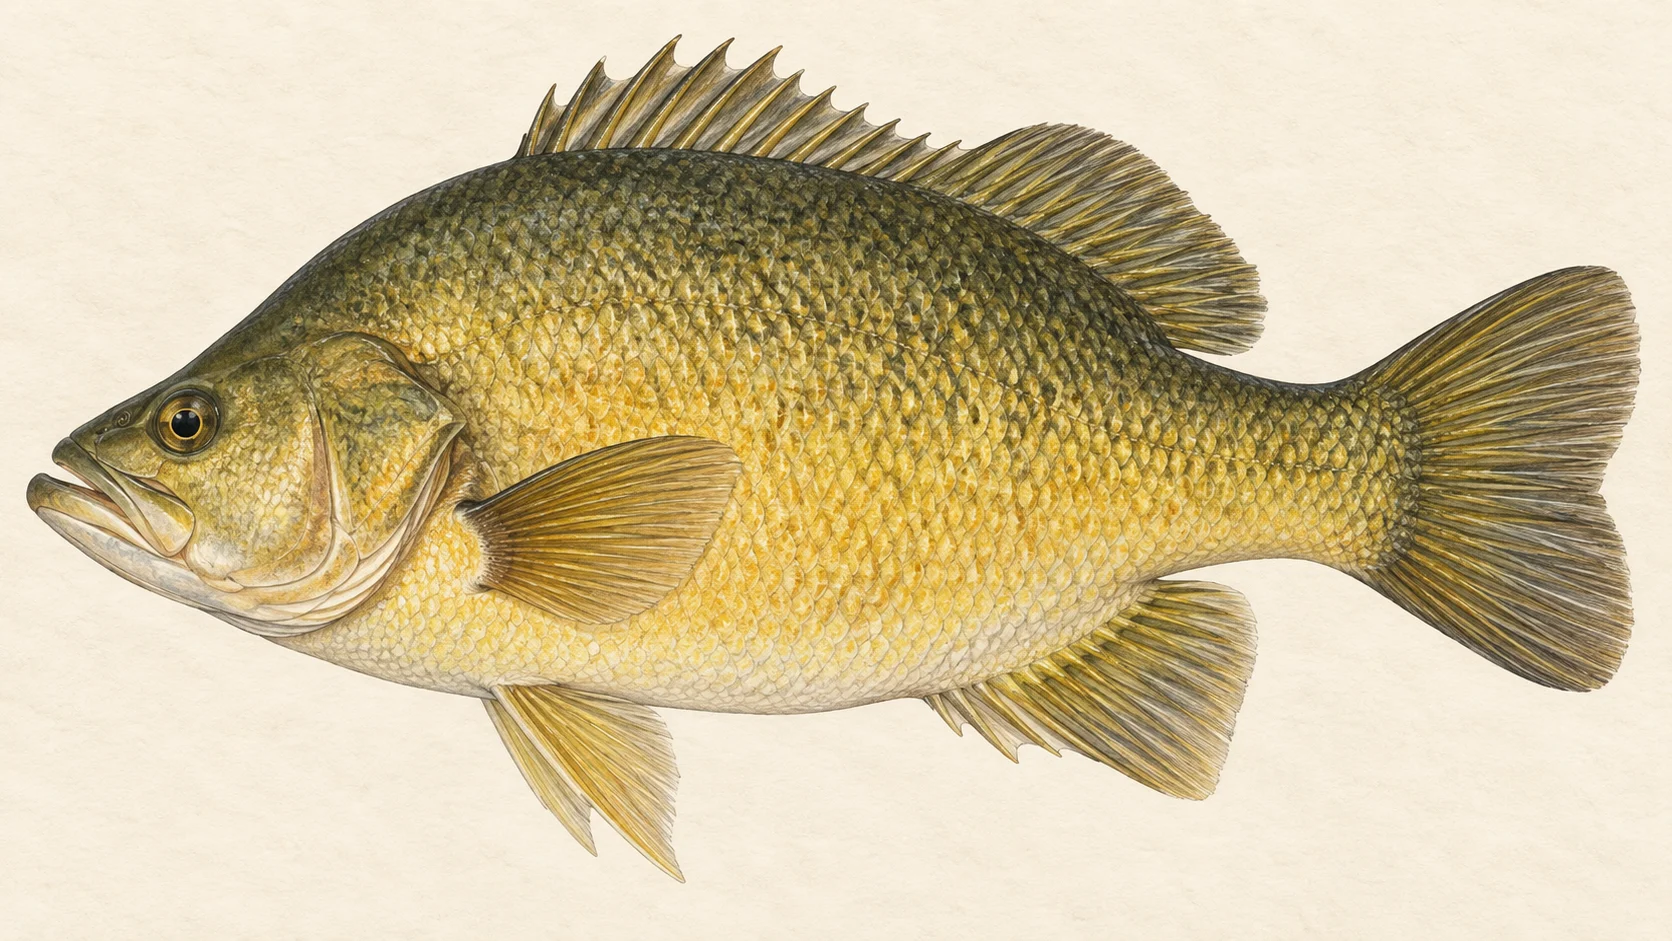
Start on the open river away from the gorge for golden perch and cod, in our experience best through the warmer months, driving in to one of the ways in the access card names, which include a boat ramp. Both fish are stocked here, so there should be young fish in the system as well as older ones. Fish the snags and deep bends with a slow streamer. Stay clear of the two weir closures, which in practice means no fishing within 50 metres either side of the upper weir face beside Chaffey Park at Manilla, and none for 150 metres below the weir face at Lake Keepit. Check the current NSW guide for the Murray cod season before you plan.

The gorge is the trip worth the drive, and it is a walk. FlyLife's writers say the fishing improves the further upstream of the usual starting point you are willing to walk, and describe the river there fishing in every season, with summer best. They put the reach at around 20 kilometres, which they say takes an experienced walker the better part of two days end to end, so choose your stretch rather than trying to see it all. Go in summer with a surface fly, walk a long way before your first serious cast, and plan on sight fishing.

Pick your trip, then check the current NSW guide for the cod season before you leave home.

Water and habitat

The gorge is the headline water. FlyLife's writers describe it widening below the Muluerindie hut, with large boulders splitting the river into a chain of rock pools of different sizes and depths. In our experience, cod in water like this sit where a pool deepens beside a boulder, or cruise the shallow margins when it is warm, and in clear water you often see them before they see you.

The same writers say that in drought the gaps between fishable pools above Muluerindie grow much longer, though the open water that remains still holds cod. In a dry year you walk further between casts; you do not have to go home.

Away from the gorge the river runs through weirs on its way to the Barwon. The gradient profile shows how its character changes, and the bank cover chart shows what lines it. On slower water, in our experience, timber, undercut banks and the outside of bends hold the fish.

Fish and forage

Murray cod and golden perch are the fish, and the stocking chart shows the releases of both season by season. For you that likely means a mix of recently stocked fish that come readily, and older settled fish that have seen a few flies. Freshwater catfish and spangled perch have been recorded too, and European carp and goldfish are present.

The small fish recorded here are the forage: Australian smelt, bony bream, carp gudgeons, hardyheads and Murray River rainbowfish. That points your fly box at small, pale baitfish patterns on the open river, and at big surface flies where cod are cruising the shallows. A dark Woolly Bugger covers the rest, and it is a good bet when nothing is showing.

When to fish it

FlyLife's writers describe the gorge fishing in every season, with summer especially good, so plan the surface-fly trip for the warm months. In our experience cod and golden perch on slower water are also most active when the water warms, from late spring through summer and into early autumn. As the water cools, slow down and fish deeper with a streamer. The Murray cod season comes from the current NSW guide, so check it before you plan any cod trip.

How to fish it

For the gorge, carry an eight weight with a floating line and a short, heavy leader. Walk the edge of each pool slowly and look before you cast. FlyLife's writers describe a surface fly for cruising cod, and in drought a slowly retrieved fly still takes fish in the pools that remain. Put the fly well ahead of a moving fish and let it sit before you give it any life. A cod that follows and turns away is often telling you to go slower.

Away from the gorge, fish a sinking-tip line and a weighted streamer tight to timber and along the outside bends, with long pauses on the retrieve. Golden perch will take a smaller fly than cod, so drop down to a size 4 or 6 if you are only getting follows.

Access and safety

The access card names the ways in, including a boat ramp. Treat them as places to reach the water, not as permission to cross private ground.
For the gorge, FlyLife's writers describe a starting point in Warrabah National Park and the Muluerindie hut, which they say can be booked through NSW National Parks, with steps down to the water. Check current access and bookings with NSW National Parks before you go. As on any walk into a bush gorge, carry more water than you think you need, wear boots that grip wet rock, and tell someone where you are going and when you expect to be back.

Regulations

All fishing methods are prohibited on the Namoi River and its tributaries from within 50 metres upstream to 50 metres downstream of the weir face at the upper weir adjacent to Chaffey Park, Manilla. All methods are also prohibited within 150 metres downstream of the weir face at Lake Keepit. Both closures are listed in the NSW Department of Primary Industries and Regional Development closed-waters notices.

Beyond those two closures, no water-specific rule was found. Check the current NSW Department of Primary Industries and Regional Development recreational fishing guide before you fish, for the Murray cod season, the licence, and the bag and size limits.

9 named access sites

These authority-listed points are separate from the mapped track intersections above. Some were inspected and some are public boat-ramp records; each row says which. A listing does not grant permission across private land, so check closures, signs and gates when you arrive.

  • Billys Hole Inspected access site · Foot access · National Park
  • Boundary Hole Inspected access site · Foot access · National Park
  • Gun Hole Inspected access site · Foot access · National Park
  • South Mcdonald Road End Inspected access site · Foot access · Public Road
  • Stone Hut Inspected access site · AWD · National Park
  • Walgett Boat Ramp Public boat-ramp record · Access mode not stated
  • Warrabah Campground Inspected access site · 2WD · National Park
  • Willow Hole Authority-listed access site · Foot access · National Park
  • Yard Hole Authority-listed access site · Foot access · National Park

Sources: NSW Department of Primary Industries and Regional Development; Transport for NSW.

When things happen

The guide's calendar for this water

When things happen

The year on this water

A year at a glance; check current rules

  • Surface flies for cod in the gorge · Nov to Mar A guide's read. FlyLife's writers single out summer in the Warrabah gorge, and a surface fly for cruising cod is the approach they describe. Check the current NSW guide for the Murray cod season before you plan the trip.
  • Slow streamer through the deeper pools · Mar to May A guide's read. When fish stop looking up, a dark Woolly Bugger, size 2 to 6, crawled slowly through the deepest pool you can find is a good bet for cod and golden perch.
  • Small native baitfish · Oct to Apr Australian smelt, bony bream, carp gudgeons, hardyheads and rainbowfish have all been recorded in the river. In our experience, when the water is warm they are the everyday food for cod and golden perch, so a small, pale streamer is rarely wrong.

What the record shows

Flows, river gradient, changing water levels, fish surveys and stocking

What the record shows

The river's year

Daily flow at Namoi River at downstream Keepit Dam, every year 1973 to 2026

0.05 0.1 0.2 0.5 1 2 5 10 20 50 typical range high-flow mark 5° 10° 15° 20° 25° Jan Feb Mar Apr May Jun Jul Aug Sep Oct Nov Dec m³/s
53 years of the gauge, week by week. The dark band is the middle half of all years, the pale band nine years in ten, the line the median. The shaded strip is the typical range: the band the river sits in about half of all days. In a typical year the river sits in it from early March to early October, and runs higher than that from early December through the turn of the year to late February. Whether a given day is one to wade is a call made at the bank, not a reading off this chart. Median flow peaks in mid January and bottoms out in mid July. The orange line is median water temperature, from about 11° in the coldest weeks to 24° in the warmest.
Source: Bureau of Meteorology.
Source details and licence

Bureau of Meteorology — Water Data Online series catalogue (Snowy/Monaro stations). Bureau of Meteorology, © Commonwealth of Australia. Licensed from the Commonwealth of Australia under a Creative Commons Attribution 4.0 International licence. retrieved 2026-08-12.

How often it runs this high

19,375 days at Namoi River at downstream Keepit Dam, 1973 to 2026

0.05 0.1 0.2 0.5 1 2 5 10 20 50 100 typical range 0.055 to 5.043 m³/s high-flow mark 17.725 m³/s 0% of days 25% of days 50% of days 75% of days 100% of days m³/s
Read it left to right: the river runs above the flow on the left edge almost never, and above the flow on the right edge almost always. Half of all days sit below 0.6 m³/s. The shaded band is the typical range, where it sits about half the time; it runs higher than that one day in three and above the high-flow mark about one day in seven. These are frequency bands drawn from the record, not a measured limit — judge the water when you get there.
Source: Bureau of Meteorology.
Source details and licence

Bureau of Meteorology — Water Data Online series catalogue (Snowy/Monaro stations). Bureau of Meteorology, © Commonwealth of Australia. Licensed from the Commonwealth of Australia under a Creative Commons Attribution 4.0 International licence. retrieved 2026-08-12.

The fall of the river

Elevation along the river, source to end

Falls 573 m over 695.5 km, fine-grained bed, floodplain pockets for much of its length.

129 416 703 gauge 419005 gauge 419007 gauge 419001 gauge 419012 gauge 419021 0 km from the source: 703 m · falling 6.2 m per km · mixed fine sediment, chain of ponds 2.32 km from the source: 683 m · falling 8.9 m per km · bedrock, gorge 4.64 km from the source: 655 m · falling 10.2 m per km · bedrock, gorge 6.96 km from the source: 625 m · falling 12 m per km · bedrock, gorge 9.27 km from the source: 591 m · falling 13.5 m per km · bedrock, gorge 11.59 km from the source: 538 m · falling 12.9 m per km · bedrock, gorge 13.91 km from the source: 520 m · falling 11.4 m per km · bedrock, gorge 16.23 km from the source: 504 m · falling 10.1 m per km · bedrock, gorge 18.55 km from the source: 477 m · falling 8.7 m per km · bedrock, gorge 20.87 km from the source: 457 m · falling 7 m per km · bedrock, gorge 23.18 km from the source: 442 m · falling 5.9 m per km · bedrock, gorge 25.5 km from the source: 428 m · falling 4.6 m per km · sand, discontinuous floodplain 27.82 km from the source: 424 m · falling 3.3 m per km · sand, discontinuous floodplain 30.14 km from the source: 420 m · falling 2.5 m per km · sand, discontinuous floodplain 32.46 km from the source: 412 m · falling 2 m per km · sand, discontinuous floodplain 34.78 km from the source: 410 m · falling 1.6 m per km · sand, discontinuous floodplain 37.09 km from the source: 411 m · falling 1.5 m per km · sand, discontinuous floodplain 39.41 km from the source: 403 m · falling 1.5 m per km · sand, discontinuous floodplain 41.73 km from the source: 398 m · falling 1.4 m per km · sand, discontinuous floodplain 44.05 km from the source: 398 m · falling 1.3 m per km · sand, discontinuous floodplain 46.37 km from the source: 398 m · falling 1.4 m per km · sand, discontinuous floodplain 48.69 km from the source: 390 m · falling 1.5 m per km · sand, discontinuous floodplain 51 km from the source: 387 m · falling 1.5 m per km · sand, discontinuous floodplain 53.32 km from the source: 386 m · falling 1.5 m per km · sand, discontinuous floodplain 55.64 km from the source: 381 m · falling 1.6 m per km · sand, discontinuous floodplain 57.96 km from the source: 376 m · falling 1.4 m per km · sand, discontinuous floodplain 60.28 km from the source: 374 m · falling 1.4 m per km · sand, discontinuous floodplain 62.6 km from the source: 371 m · falling 1.4 m per km · sand, discontinuous floodplain 64.92 km from the source: 367 m · falling 1.3 m per km · sand, discontinuous floodplain 67.23 km from the source: 365 m · falling 1.3 m per km · sand, discontinuous floodplain 69.55 km from the source: 364 m · falling 1.4 m per km · gravel, discontinuous floodplain 71.87 km from the source: 359 m · falling 1.5 m per km · gravel, discontinuous floodplain 74.19 km from the source: 355 m · falling 1.6 m per km · gravel, discontinuous floodplain 76.51 km from the source: 353 m · falling 1.6 m per km · gravel, discontinuous floodplain 78.83 km from the source: 346 m · falling 1.5 m per km · gravel, discontinuous floodplain 81.14 km from the source: 343 m · falling 1.2 m per km · gravel, discontinuous floodplain 83.46 km from the source: 340 m · falling 1 m per km · gravel, discontinuous floodplain 85.78 km from the source: 340 m · falling 0.9 m per km · sand, discontinuous floodplain 88.1 km from the source: 338 m · falling 0.8 m per km · gravel, discontinuous floodplain 90.42 km from the source: 336 m · falling 0.9 m per km · gravel, discontinuous floodplain 92.74 km from the source: 334 m · falling 0.9 m per km · water storage 95.05 km from the source: 332 m · falling 0.9 m per km · water storage 97.37 km from the source: 329 m · falling 0.9 m per km · water storage 99.69 km from the source: 326 m · falling 0.8 m per km · water storage 102.01 km from the source: 326 m · falling 0.7 m per km · water storage 104.33 km from the source: 323 m · falling 0.5 m per km · water storage 106.65 km from the source: 322 m · falling 0.3 m per km · water storage 108.96 km from the source: 323 m · falling 0.1 m per km · water storage 111.28 km from the source: 323 m · falling 0.1 m per km · water storage 113.6 km from the source: 323 m · falling 0 m per km · water storage 115.92 km from the source: 323 m · falling 0.5 m per km · water storage 118.24 km from the source: 323 m · falling 1.1 m per km · water storage 120.56 km from the source: 323 m · falling 1.8 m per km · water storage 122.88 km from the source: 321 m · falling 2.4 m per km · water storage 125.19 km from the source: 300 m · falling 2.6 m per km · gravel, discontinuous floodplain 127.51 km from the source: 297 m · falling 2.2 m per km · gravel, discontinuous floodplain 129.83 km from the source: 293 m · falling 1.9 m per km · gravel, discontinuous floodplain 132.15 km from the source: 290 m · falling 1.3 m per km · gravel, discontinuous floodplain 134.47 km from the source: 291 m · falling 0.9 m per km · gravel, discontinuous floodplain 136.79 km from the source: 289 m · falling 0.8 m per km · gravel, discontinuous floodplain 139.1 km from the source: 284 m · falling 0.7 m per km · gravel, discontinuous floodplain 141.42 km from the source: 284 m · falling 0.6 m per km · gravel, discontinuous floodplain 143.74 km from the source: 284 m · falling 0.5 m per km · gravel, discontinuous floodplain 146.06 km from the source: 281 m · falling 0.5 m per km · gravel, discontinuous floodplain 148.38 km from the source: 282 m · falling 0.4 m per km · gravel, discontinuous floodplain 150.7 km from the source: 281 m · falling 0.5 m per km · gravel, discontinuous floodplain 153.01 km from the source: 278 m · falling 0.4 m per km · gravel 155.33 km from the source: 277 m · falling 0.3 m per km · gravel 157.65 km from the source: 277 m · falling 0.3 m per km · gravel 159.97 km from the source: 277 m · falling 0.3 m per km · gravel 162.29 km from the source: 278 m · falling 0.4 m per km · gravel 164.61 km from the source: 275 m · falling 0.5 m per km · gravel 166.92 km from the source: 274 m · falling 0.6 m per km · gravel 169.24 km from the source: 273 m · falling 0.7 m per km · gravel 171.56 km from the source: 270 m · falling 0.7 m per km · gravel 173.88 km from the source: 268 m · falling 0.6 m per km · gravel 176.2 km from the source: 268 m · falling 0.6 m per km · gravel 178.52 km from the source: 267 m · falling 0.5 m per km · gravel 180.84 km from the source: 265 m · falling 0.5 m per km · gravel 183.15 km from the source: 263 m · falling 0.4 m per km · gravel 185.47 km from the source: 264 m · falling 0.4 m per km · gravel 187.79 km from the source: 263 m · falling 0.4 m per km · gravel 190.11 km from the source: 261 m · falling 0.3 m per km · gravel 192.43 km from the source: 262 m · falling 0.3 m per km · gravel 194.75 km from the source: 260 m · falling 0.4 m per km · gravel 197.06 km from the source: 260 m · falling 0.4 m per km · gravel 199.38 km from the source: 258 m · falling 0.4 m per km · gravel 201.7 km from the source: 258 m · falling 0.4 m per km · gravel 204.02 km from the source: 256 m · falling 0.4 m per km · gravel 206.34 km from the source: 256 m · falling 0.3 m per km · gravel 208.66 km from the source: 256 m · falling 0.3 m per km · gravel 210.97 km from the source: 255 m · falling 0.3 m per km · gravel 213.29 km from the source: 254 m · falling 0.4 m per km · gravel 215.61 km from the source: 253 m · falling 0.4 m per km · gravel 217.93 km from the source: 252 m · falling 0.4 m per km · gravel 220.25 km from the source: 251 m · falling 0.5 m per km · gravel 222.57 km from the source: 249 m · falling 0.4 m per km · gravel 224.88 km from the source: 249 m · falling 0.4 m per km · gravel 227.2 km from the source: 248 m · falling 0.4 m per km · gravel 229.52 km from the source: 247 m · falling 0.4 m per km · gravel 231.84 km from the source: 247 m · falling 0.4 m per km · gravel 234.16 km from the source: 245 m · falling 0.4 m per km · gravel 236.48 km from the source: 244 m · falling 0.4 m per km · gravel 238.8 km from the source: 242 m · falling 0.3 m per km · gravel 241.11 km from the source: 245 m · falling 0.3 m per km · gravel 243.43 km from the source: 243 m · falling 0.4 m per km · gravel 245.75 km from the source: 241 m · falling 0.4 m per km · gravel 248.07 km from the source: 240 m · falling 0.4 m per km · gravel 250.39 km from the source: 239 m · falling 0.4 m per km · gravel 252.71 km from the source: 238 m · falling 0.3 m per km · gravel 255.02 km from the source: 237 m · falling 0.3 m per km · gravel 257.34 km from the source: 239 m · falling 0.2 m per km · gravel 259.66 km from the source: 237 m · falling 0.3 m per km · gravel 261.98 km from the source: 236 m · falling 0.3 m per km · gravel 264.3 km from the source: 234 m · falling 0.3 m per km · gravel 266.62 km from the source: 236 m · falling 0.3 m per km · gravel 268.93 km from the source: 234 m · falling 0.3 m per km · gravel 271.25 km from the source: 233 m · falling 0.2 m per km · gravel 273.57 km from the source: 233 m · falling 0.1 m per km · gravel 275.89 km from the source: 234 m · falling 0.2 m per km · gravel 278.21 km from the source: 232 m · falling 0.2 m per km · gravel 280.53 km from the source: 232 m · falling 0.2 m per km · gravel 282.84 km from the source: 232 m · falling 0.3 m per km · gravel 285.16 km from the source: 230 m · falling 0.4 m per km · gravel 287.48 km from the source: 230 m · falling 0.5 m per km · gravel 289.8 km from the source: 229 m · falling 0.5 m per km · gravel 292.12 km from the source: 228 m · falling 0.5 m per km · gravel 294.44 km from the source: 225 m · falling 0.4 m per km · gravel 296.76 km from the source: 224 m · falling 0.3 m per km · gravel 299.07 km from the source: 224 m · falling 0.2 m per km · gravel 301.39 km from the source: 225 m · falling 0.2 m per km · gravel 303.71 km from the source: 224 m · falling 0.2 m per km · gravel 306.03 km from the source: 225 m · falling 0.3 m per km · gravel 308.35 km from the source: 222 m · falling 0.4 m per km · gravel 310.67 km from the source: 220 m · falling 0.4 m per km · gravel 312.98 km from the source: 220 m · falling 0.4 m per km · gravel 315.3 km from the source: 220 m · falling 0.4 m per km · gravel 317.62 km from the source: 218 m · falling 0.3 m per km · gravel 319.94 km from the source: 219 m · falling 0.3 m per km · gravel 322.26 km from the source: 216 m · falling 0.3 m per km · gravel 324.58 km from the source: 217 m · falling 0.3 m per km · gravel 326.89 km from the source: 218 m · falling 0.4 m per km · gravel 329.21 km from the source: 215 m · falling 0.5 m per km · gravel 331.53 km from the source: 214 m · falling 0.5 m per km · gravel 333.85 km from the source: 214 m · falling 0.6 m per km · gravel 336.17 km from the source: 210 m · falling 0.5 m per km · gravel 338.49 km from the source: 209 m · falling 0.4 m per km · gravel 340.8 km from the source: 209 m · falling 0.3 m per km · gravel 343.12 km from the source: 209 m · falling 0.3 m per km · gravel 345.44 km from the source: 209 m · falling 0.3 m per km · gravel 347.76 km from the source: 209 m · falling 0.3 m per km · gravel 350.08 km from the source: 205 m · falling 0.3 m per km · gravel 352.4 km from the source: 205 m · falling 0.3 m per km · gravel 354.72 km from the source: 205 m · falling 0.3 m per km · gravel 357.03 km from the source: 207 m · falling 0.3 m per km · gravel 359.35 km from the source: 204 m · falling 0.4 m per km · gravel 361.67 km from the source: 202 m · falling 0.4 m per km · gravel 363.99 km from the source: 203 m · falling 0.4 m per km · gravel 366.31 km from the source: 202 m · falling 0.5 m per km · gravel 368.63 km from the source: 200 m · falling 0.4 m per km · gravel 370.94 km from the source: 199 m · falling 0.4 m per km · gravel 373.26 km from the source: 197 m · falling 0.4 m per km · gravel 375.58 km from the source: 198 m · falling 0.4 m per km · gravel 377.9 km from the source: 196 m · falling 0.4 m per km · gravel 380.22 km from the source: 195 m · falling 0.3 m per km · gravel 382.54 km from the source: 195 m · falling 0.3 m per km · gravel 384.85 km from the source: 195 m · falling 0.3 m per km · fine-grained 387.17 km from the source: 193 m · falling 0.3 m per km · fine-grained 389.49 km from the source: 193 m · falling 0.2 m per km · fine-grained 391.81 km from the source: 193 m · falling 0.3 m per km · fine-grained 394.13 km from the source: 191 m · falling 0.2 m per km · fine-grained 396.45 km from the source: 191 m · falling 0.2 m per km · fine-grained 398.76 km from the source: 191 m · falling 0.1 m per km · fine-grained 401.08 km from the source: 190 m · falling 0.1 m per km · fine-grained 403.4 km from the source: 192 m · falling 0.1 m per km · fine-grained 405.72 km from the source: 190 m · falling 0.2 m per km · fine-grained 408.04 km from the source: 193 m · falling 0.3 m per km · fine-grained 410.36 km from the source: 188 m · falling 0.4 m per km · fine-grained 412.68 km from the source: 188 m · falling 0.5 m per km · fine-grained 414.99 km from the source: 186 m · falling 0.5 m per km · fine-grained 417.31 km from the source: 186 m · falling 0.5 m per km · fine-grained 419.63 km from the source: 185 m · falling 0.4 m per km · fine-grained 421.95 km from the source: 184 m · falling 0.3 m per km · fine-grained 424.27 km from the source: 182 m · falling 0.2 m per km · fine-grained 426.59 km from the source: 182 m · falling 0.2 m per km · fine-grained 428.9 km from the source: 183 m · falling 0.2 m per km · fine-grained 431.22 km from the source: 183 m · falling 0.2 m per km · fine-grained 433.54 km from the source: 182 m · falling 0.3 m per km · fine-grained 435.86 km from the source: 181 m · falling 0.3 m per km · fine-grained 438.18 km from the source: 179 m · falling 0.3 m per km · fine-grained 440.5 km from the source: 179 m · falling 0.3 m per km · fine-grained 442.81 km from the source: 179 m · falling 0.3 m per km · fine-grained 445.13 km from the source: 181 m · falling 0.4 m per km · fine-grained 447.45 km from the source: 176 m · falling 0.4 m per km · fine-grained 449.77 km from the source: 176 m · falling 0.3 m per km · fine-grained 452.09 km from the source: 176 m · falling 0.3 m per km · fine-grained 454.41 km from the source: 174 m · falling 0.3 m per km · fine-grained 456.72 km from the source: 175 m · falling 0.3 m per km · fine-grained 459.04 km from the source: 174 m · falling 0.2 m per km · fine-grained 461.36 km from the source: 174 m · falling 0.3 m per km · fine-grained 463.68 km from the source: 172 m · falling 0.3 m per km · fine-grained 466 km from the source: 171 m · falling 0.3 m per km · fine-grained 468.32 km from the source: 174 m · falling 0.4 m per km · fine-grained 470.64 km from the source: 169 m · falling 0.5 m per km · fine-grained 472.95 km from the source: 169 m · falling 0.4 m per km · fine-grained 475.27 km from the source: 167 m · falling 0.3 m per km · fine-grained 477.59 km from the source: 167 m · falling 0.3 m per km · fine-grained 479.91 km from the source: 168 m · falling 0.2 m per km · fine-grained 482.23 km from the source: 166 m · falling 0.2 m per km · fine-grained 484.55 km from the source: 167 m · falling 0.2 m per km · fine-grained 486.86 km from the source: 166 m · falling 0.4 m per km · fine-grained 489.18 km from the source: 165 m · falling 0.4 m per km · fine-grained 491.5 km from the source: 163 m · falling 0.3 m per km · fine-grained 493.82 km from the source: 164 m · falling 0.3 m per km · fine-grained 496.14 km from the source: 160 m · falling 0.2 m per km · fine-grained 498.46 km from the source: 164 m · falling 0.1 m per km · fine-grained 500.77 km from the source: 163 m · falling 0.2 m per km · fine-grained 503.09 km from the source: 159 m · falling 0.1 m per km · fine-grained 505.41 km from the source: 162 m · falling 0.1 m per km · fine-grained 507.73 km from the source: 161 m · falling 0.2 m per km · fine-grained 510.05 km from the source: 161 m · falling 0.2 m per km · fine-grained 512.37 km from the source: 161 m · falling 0.2 m per km · fine-grained 514.68 km from the source: 159 m · falling 0.3 m per km · fine-grained 517 km from the source: 158 m · falling 0.3 m per km · fine-grained 519.32 km from the source: 158 m · falling 0.3 m per km · fine-grained 521.64 km from the source: 157 m · falling 0.3 m per km · fine-grained 523.96 km from the source: 156 m · falling 0.2 m per km · fine-grained 526.28 km from the source: 158 m · falling 0.2 m per km · fine-grained 528.6 km from the source: 155 m · falling 0.3 m per km · fine-grained 530.91 km from the source: 154 m · falling 0.2 m per km · fine-grained 533.23 km from the source: 155 m · falling 0.2 m per km · fine-grained 535.55 km from the source: 155 m · falling 0.3 m per km · fine-grained 537.87 km from the source: 152 m · falling 0.2 m per km · fine-grained 540.19 km from the source: 155 m · falling 0.3 m per km · fine-grained 542.51 km from the source: 151 m · falling 0.4 m per km · fine-grained 544.82 km from the source: 152 m · falling 0.4 m per km · fine-grained 547.14 km from the source: 150 m · falling 0.3 m per km · fine-grained 549.46 km from the source: 148 m · falling 0.3 m per km · fine-grained 551.78 km from the source: 149 m · falling 0.1 m per km · fine-grained 554.1 km from the source: 149 m · falling 0.1 m per km · fine-grained 556.42 km from the source: 148 m · falling 0.1 m per km · fine-grained 558.73 km from the source: 150 m · falling 0.1 m per km · fine-grained 561.05 km from the source: 148 m · falling 0.2 m per km · fine-grained 563.37 km from the source: 147 m · falling 0.1 m per km · fine-grained 565.69 km from the source: 147 m · falling 0.1 m per km · fine-grained 568.01 km from the source: 149 m · falling 0.1 m per km · fine-grained 570.33 km from the source: 146 m · falling 0.1 m per km · fine-grained 572.64 km from the source: 148 m · falling 0.2 m per km · fine-grained 574.96 km from the source: 146 m · falling 0.2 m per km · fine-grained 577.28 km from the source: 146 m · falling 0.2 m per km · fine-grained 579.6 km from the source: 144 m · falling 0.1 m per km · fine-grained 581.92 km from the source: 145 m · falling 0.1 m per km · fine-grained 584.24 km from the source: 145 m · falling 0.2 m per km · fine-grained 586.56 km from the source: 146 m · falling 0.3 m per km · fine-grained 588.87 km from the source: 144 m · falling 0.4 m per km · fine-grained 591.19 km from the source: 143 m · falling 0.5 m per km · fine-grained 593.51 km from the source: 142 m · falling 0.4 m per km · fine-grained 595.83 km from the source: 139 m · falling 0.3 m per km · fine-grained 598.15 km from the source: 139 m · falling 0.2 m per km · fine-grained 600.47 km from the source: 139 m · falling 0.1 m per km · fine-grained 602.78 km from the source: 141 m · falling 0.1 m per km · fine-grained 605.1 km from the source: 140 m · falling 0.1 m per km · fine-grained 607.42 km from the source: 139 m · falling 0 m per km · fine-grained 609.74 km from the source: 138 m · falling -0.1 m per km · fine-grained 612.06 km from the source: 139 m · falling -0.1 m per km · fine-grained 614.38 km from the source: 141 m · falling -0.1 m per km · fine-grained 616.69 km from the source: 142 m · falling -0.1 m per km · fine-grained 619.01 km from the source: 142 m · falling 0.1 m per km · fine-grained 621.33 km from the source: 138 m · falling 0.2 m per km · fine-grained 623.65 km from the source: 140 m · falling 0.2 m per km · fine-grained 625.97 km from the source: 139 m · falling 0.2 m per km · fine-grained 628.29 km from the source: 138 m · falling 0.2 m per km · fine-grained 630.61 km from the source: 139 m · falling 0.2 m per km · fine-grained 632.92 km from the source: 138 m · falling 0.3 m per km · fine-grained 635.24 km from the source: 136 m · falling 0.2 m per km · fine-grained 637.56 km from the source: 136 m · falling 0.2 m per km · fine-grained 639.88 km from the source: 136 m · falling 0.2 m per km · fine-grained 642.2 km from the source: 135 m · falling 0.1 m per km · fine-grained 644.52 km from the source: 137 m · falling 0.1 m per km · fine-grained 646.83 km from the source: 134 m · falling 0.2 m per km · fine-grained 649.15 km from the source: 135 m · falling 0.1 m per km · fine-grained 651.47 km from the source: 134 m · falling 0.2 m per km · fine-grained 653.79 km from the source: 133 m · falling 0.1 m per km · fine-grained 656.11 km from the source: 135 m · falling 0.1 m per km · fine-grained 658.43 km from the source: 133 m · falling 0.1 m per km · fine-grained 660.74 km from the source: 132 m · falling 0.1 m per km · fine-grained 663.06 km from the source: 133 m · falling 0.1 m per km · fine-grained 665.38 km from the source: 133 m · falling 0.2 m per km · fine-grained 667.7 km from the source: 133 m · falling 0.2 m per km · fine-grained 670.02 km from the source: 132 m · falling 0.1 m per km · fine-grained 672.34 km from the source: 131 m · falling 0.1 m per km · fine-grained 674.65 km from the source: 131 m · falling 0.1 m per km · fine-grained 676.97 km from the source: 130 m · falling 0.1 m per km · fine-grained 679.29 km from the source: 134 m · falling 0.1 m per km · fine-grained 681.61 km from the source: 130 m · falling 0.1 m per km · fine-grained 683.93 km from the source: 129 m · falling 0.1 m per km · fine-grained 686.25 km from the source: 131 m · falling 0.1 m per km · fine-grained 688.57 km from the source: 130 m · falling 0.1 m per km · fine-grained 690.88 km from the source: 129 m · falling 0 m per km · fine-grained 693.2 km from the source: 130 m · falling 0 m per km · fine-grained 695.52 km from the source: 130 m · falling 0.1 m per km · fine-grained 0 km 174 km 348 km 522 km 696 km
bedrock · 3% gravel · 40% sand · 7% fine-grained · 45% mixed fine sediment · 0% unstated · 5%
Headwater
703 m
Outlet
130 m
Typical drop
0.8 m/km
Steepest sampled stretch
13.5 m/km, near 9.27 km
Hover the profile for the reading at any kilometre.
Source: Geoscience Australia.
Source details and licence

Geoscience Australia — 1 second SRTM-derived DEM-H v1.0 (NCI tile store). Geoscience Australia, 1 second SRTM-derived DEM-H v1.0, © Commonwealth of Australia, CC BY 4.0. retrieved 2026-08-16.

Bed material: NSW Department of Climate Change, Energy, the Environment and Water (Water, Surface Water Science).
Source details and licence

NSW River Styles spatial dataset — geomorphic character and dominant bed material. NSW River Styles spatial dataset, © State Government of NSW and NSW Department of Climate Change, Energy, the Environment and Water 2023. retrieved 2026-08-21.

Gauge pins identify the monitoring stations. The slope shows how steeply the river falls; it does not show rapids or safe wading routes.

The banks, seen from space

Land cover in the 120 m beside the water, Landsat 2023 to 2024 to 2025

0 to 50 km: woody dense 0.4% 0 to 50 km: woody open 60.4% 0 to 50 km: woody sparse 12.6% 0 to 50 km: herbaceous native 19.3% 0 to 50 km: cultivated 7.3% 50 to 100 km: woody dense 2.1% 50 to 100 km: woody open 44.5% 50 to 100 km: woody sparse 1.6% 50 to 100 km: herbaceous native 25.1% 50 to 100 km: cultivated 26.7% 100 to 150 km: woody dense 1% 100 to 150 km: woody open 35.3% 100 to 150 km: woody sparse 4.8% 100 to 150 km: herbaceous native 41.2% 100 to 150 km: cultivated 17.3% 100 to 150 km: bare 0.4% 150 to 200 km: woody dense 2% 150 to 200 km: woody open 39.2% 150 to 200 km: woody sparse 5.1% 150 to 200 km: herbaceous native 22.9% 150 to 200 km: cultivated 30.7% 150 to 200 km: bare 0.1% 200 to 250 km: woody dense 4.3% 200 to 250 km: woody open 33.8% 200 to 250 km: woody sparse 2.7% 200 to 250 km: herbaceous native 10% 200 to 250 km: cultivated 48.8% 200 to 250 km: bare 0.4% 250 to 300 km: woody dense 2.5% 250 to 300 km: woody open 28.3% 250 to 300 km: woody sparse 6.1% 250 to 300 km: herbaceous native 9.7% 250 to 300 km: cultivated 52.7% 250 to 300 km: bare 0.7% 300 to 350 km: woody dense 7.8% 300 to 350 km: woody open 31.2% 300 to 350 km: woody sparse 2.1% 300 to 350 km: herbaceous native 17.5% 300 to 350 km: cultivated 41.3% 300 to 350 km: bare 0.1% 350 to 400 km: woody dense 7% 350 to 400 km: woody open 54.7% 350 to 400 km: woody sparse 4.7% 350 to 400 km: herbaceous native 12.8% 350 to 400 km: cultivated 19.4% 350 to 400 km: bare 1.4% 400 to 450 km: woody dense 6.4% 400 to 450 km: woody open 72.8% 400 to 450 km: woody sparse 6% 400 to 450 km: herbaceous native 5.5% 400 to 450 km: cultivated 8.8% 400 to 450 km: bare 0.5% 450 to 500 km: woody dense 2.1% 450 to 500 km: woody open 78.9% 450 to 500 km: woody sparse 3.2% 450 to 500 km: herbaceous native 10.8% 450 to 500 km: cultivated 5% 500 to 550 km: woody dense 0.5% 500 to 550 km: woody open 60.3% 500 to 550 km: woody sparse 15.1% 500 to 550 km: herbaceous native 18.4% 500 to 550 km: cultivated 5.4% 500 to 550 km: bare 0.3% 550 to 600 km: woody dense 0.3% 550 to 600 km: woody open 65.6% 550 to 600 km: woody sparse 16.2% 550 to 600 km: herbaceous native 13.9% 550 to 600 km: cultivated 3.9% 550 to 600 km: bare 0.1% 600 to 650 km: woody open 59.9% 600 to 650 km: woody sparse 17.9% 600 to 650 km: herbaceous native 18.8% 600 to 650 km: cultivated 3.3% 600 to 650 km: bare 0.1% 650 to 695 km: woody open 61.8% 650 to 695 km: woody sparse 14.6% 650 to 695 km: herbaceous native 23.1% 650 to 695 km: cultivated 0.1% 650 to 695 km: bare 0.3% 650 to 695 km: artificial 0.1% 0 km 50 km 100 km 150 km 200 km 250 km 300 km 350 km 400 km 450 km 500 km 550 km 600 km 650 km
dense forest open woodland scattered trees and scrub native grass and heath farmed or cleared bare ground lake
Along the river itself about 63% of the bank is under trees, 17% is native grass or heath and 20% is farmed. The most wooded stretch is 400 to 450 km from the source; the most open is 250 to 300 km. A satellite reads the canopy, not the ground beneath it, so treat this as a read of the country, not a survey of every bank.
Source: Geoscience Australia / Digital Earth Australia.
Source details and licence

DEA Land Cover (Landsat) — Level 4 classification, continental mosaics. © Commonwealth of Australia (Geoscience Australia). DEA Land Cover (Landsat), Digital Earth Australia. retrieved 2026-08-19.

How well this water has been surveyed

345 capture records, 4 decades of 4 on file

0 50 100 150 200 1990s: 3 capture records 2000s: 122 capture records 2000s: 28 capture records 2000s: 9 capture records 2010s: 127 capture records 2010s: 21 capture records 2010s: 31 capture records 2010s: 3 capture records 2020s: 1 capture record 1990s 2000s 2010s 2020s
electrofishing (boat), 249 records electrofishing (backpack), 49 records electrofishing (other), 3 records seine netting, 32 records trapping, 12 records
Capture records by decade — electrofishing, netting, trapping and rotenone surveys only; a sighting, an eDNA water sample or a stocking release is not a capture and is not counted here. A record is not an abundance estimate, and a decade with no bar is a decade with no capture survey on file, not evidence the water was empty.
Source: Atlas of Living Australia.
Source details and licence

Atlas of Living Australia — freshwater fish occurrence records (open licences, with coordinates). Occurrence records from the Atlas of Living Australia and its contributing datasets, including the Victorian Biodiversity Atlas, NSW BioNet Atlas, Sustainable Rivers Audit, Murray-Darling Basin fish monitoring programs, OZCAM museum collections and iNaturalist Australia. Each record carries its own licence and originating dataset. retrieved 2026-08-13.

Stocking on record

211,014 fish in 81 records, 2020 to 2026

0 20k 40k 60k 2020: 11,220 murray cod in 4 records 2021: 19,200 golden perch in 4 records 2021: 22,800 murray cod in 5 records 2022: 10,923 golden perch in 7 records 2022: 12,722 murray cod in 8 records 2023: 34,903 golden perch in 13 records 2023: 11,396 murray cod in 13 records 2024: 51,935 golden perch in 11 records 2024: 5,000 murray cod in 1 record 2025: 7,500 murray cod in 6 records 2026: 14,795 golden perch in 5 records 2026: 8,620 murray cod in 4 records 2020 2021 2022 2023 2024 2025 2026
Golden Perch, 131,756 across 40 records Murray Cod, 79,258 across 41 records
Stocked in 7 of the 7 years from 2020 to 2026. These are site-by-year totals, which can combine more than one release. A record is not a promise that stocking continues, and not evidence of what is in the water now.
Source: NSW Department of Primary Industries and Regional Development (Fisheries).
Source details and licence

NSW Fish Stocking — ArcGIS site markers and linked histories. retrieved 2026-08-29.

Conditions

What the gauges say

Namoi River at Gunnedah

River flow

No reading shown: No reading has been captured for this gauge yet, so none is shown.

Gauge height

No reading shown: No reading has been captured for this gauge yet, so none is shown.

Water temperature

No reading shown: No reading has been captured for this gauge yet, so none is shown.

Namoi River at North Cuerindi

River flow

No reading shown: No reading has been captured for this gauge yet, so none is shown.

Gauge height

No reading shown: No reading has been captured for this gauge yet, so none is shown.

Water temperature

No reading shown: No reading has been captured for this gauge yet, so none is shown.

Namoi River at downstream Keepit Dam

River flow

No reading shown: No reading has been captured for this gauge yet, so none is shown.

Gauge height

No reading shown: No reading has been captured for this gauge yet, so none is shown.

Water temperature

No reading shown: No reading has been captured for this gauge yet, so none is shown.

Namoi River at Boggabri

River flow

No reading shown: No reading has been captured for this gauge yet, so none is shown.

Gauge height

No reading shown: No reading has been captured for this gauge yet, so none is shown.

Water temperature

No reading shown: No reading has been captured for this gauge yet, so none is shown.

Namoi River at Bugilbone (Riverview)

River flow

No reading shown: No reading has been captured for this gauge yet, so none is shown.

Gauge height

No reading shown: No reading has been captured for this gauge yet, so none is shown.

Water temperature

No reading shown: No reading has been captured for this gauge yet, so none is shown.

Readings from the Bureau of Meteorology's Water Data Online, © Commonwealth of Australia, licensed CC BY 4.0. Nothing here is a forecast. Check the gauge before you rely on it.

Weather

What the sky is doing

Live weather for Namoi River at Gunnedah loads here. If it does not, check the Bureau of Meteorology forecast before you go.

Weather data by Open-Meteo.com

Questions anglers ask

What will I catch on the Namoi?

Murray cod and golden perch are the targets, and both have been stocked here as well as recorded in surveys. Freshwater catfish and spangled perch have also been recorded, and European carp are present.

Is there anywhere I cannot fish?

Yes. All fishing is closed from 50 metres upstream to 50 metres downstream of the face of the upper weir beside Chaffey Park at Manilla, and for 150 metres downstream of the weir face at Lake Keepit. Both closures cover the river and its tributaries within those limits.

Is there a closed season, bag or size limit?

No season, bag or size rule specific to the Namoi was found beyond the two weir closures. Take the Murray cod season and the bag and size limits from the current NSW Department of Primary Industries and Regional Development recreational fishing guide before you fish.

Can I stay near the gorge?

FlyLife's writers describe Muluerindie, a stone hut run by NSW National Parks above the gorge in Warrabah National Park, with steps down to the river. Check with NSW National Parks for bookings and current access before you go.

Where do I get in?

The access card names the ways in, including a boat ramp. Treat them as places to reach the water, not as permission to cross private ground.

Behind this page