Australia Fly Guide
ACT · Murrumbidgee River

Paddys River

Imagery © Esri

Paddys River is one of the ACT's bigger trout waters, and the territory classifies the whole catchment as trout water, so the rules do not change along it.

It is a deep-nymphing river first. FlyLife's writers rank the Cotter first and put Paddys with the Naas as the pick for deep nymphing. In our experience, as the river drops through summer the same runs fish to a dry-dropper, and the banks are worth a hopper from midsummer.

Trout water means a season from the October Labour Day long weekend to the end of the June King's Birthday long weekend, fly and lure only, no bait, and one rod at a time.

If you are new to the ACT's trout, learn the Cotter first and come here second.

Water and habitat

The mapped river is about thirty-two kilometres of mainstem. The flow charts show the river's year and flow duration from its gauges, with the fall of the river and the bank survey beside them. In our read it is a river of runs and pools that rewards getting a nymph to the bottom.

Fish and forage

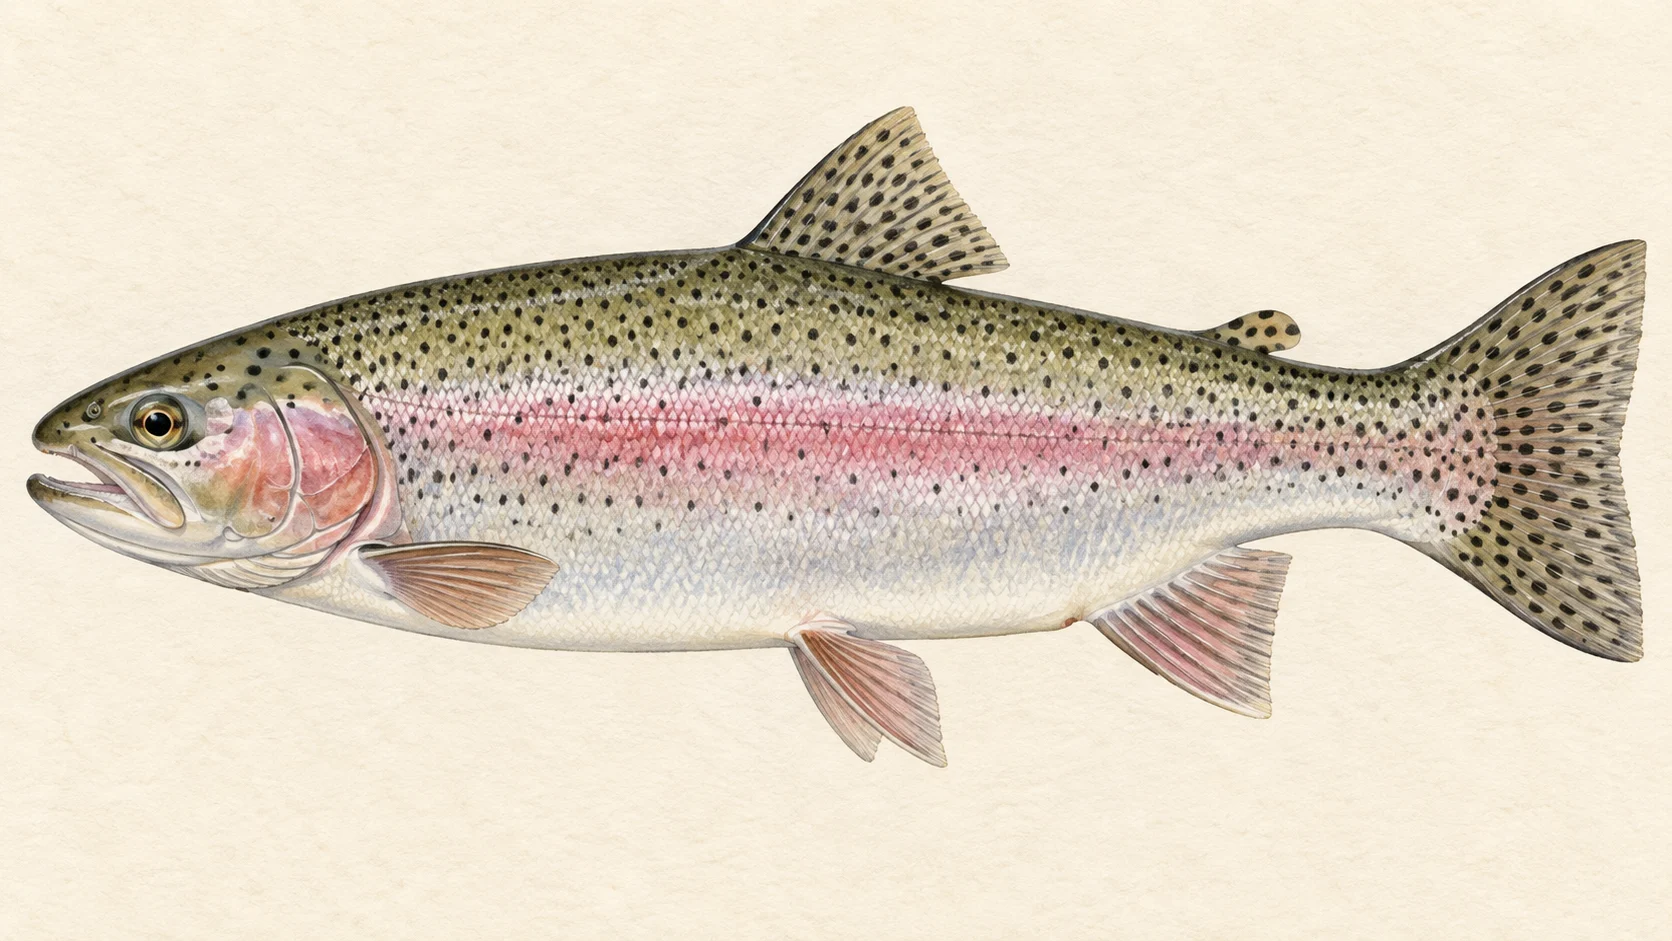
The territory classes the river as trout water, and its trout rules name brown and rainbow trout. Records of either in Paddys itself are thin, so read the river for what it shows you.

In our experience, mayfly on the warm afternoons, hoppers along the banks in summer, and the general drift of a cold clear river are the food. Check the current ACT fishing brochure for protected species before you fish.

When to fish it

The season opens on the October Labour Day long weekend and closes after the June King's Birthday long weekend; the dates move with the calendar. In our experience spring is for deep nymphs, from late November the river settles into dry-dropper water, and summer afternoons are for a hopper tight to the bank.

How to fish it

In spring, an indicator and a heavy nymph rig, fished in the slower water beside the main current so the flies plummet away from the flow, one run at a time, and expect the take at the tail-out. In summer, a buoyant dry with a small nymph below it through the pockets and runs, and a hopper along the tussock edges in the afternoon.

The gear rules in trout water: one rod at a time, a landing net, no more than two flies or one lure on the line, and no bait rigged or carried beside the water.

Access and safety

Use formed public roads and tracks, obey signs and gates, and check the ACT Parks nature park finder before you go. As on any mountain river, if the water is running high, fish from the bank or come back later.

Regulations

The ACT lists Paddys River and its catchment and tributaries as Trout Water. In trout water, fishing is open from the start of the October Labour Day long weekend to the end of the June King's Birthday long weekend; only artificial fly and lure fishing is allowed in the open season; bait fishing is prohibited; you may use one rod at a time and a landing net; the rod may carry no more than two flies or one artificial lure; and it is an offence to possess a handline, more than two rods, a rod rigged for bait, or any net other than a landing net in or beside the water.

Check the current territory brochure for any size or bag limit before you fish.
River map & ways in

The water from source to end, with mapped tracks and walking lines

River map and ways in to Paddys River

Paddys River Paddys River Walk in along Bullen Range Road Walk in along Bfg Road Walk in along Riverlea Firetrail Walk in along Jamo Break Walk in along Swimming Hole Road Walk in along Bullen Road Walk in along Mineshaft Road Walk in along Old Mine Road Walk in along Archery Road Walk in along Scenic Road Walk in along Booroomba Road Leave Horse Paddock Road here Unnamed track off Horse Paddock Road Leave Old Mine Road here Bullen Range Road Leave Paddys River Road here Bfg Road Discovery Drive Leave Bullen Firetrail here Riverlea Firetrail Leave Paddys River Road here Unnamed track off Paddys River Road Leave Bullen Road here Jamo Break Leave Jamo Break here Swimming Hole Road Paddys River Road Leave Swimming Hole Road here Bullen Road Leave Paddys River Road here Mineshaft Road Leave Paddys River Road here Unnamed track off Paddys River Road Leave Bullen Road here Old Mine Road Leave Gravel Pit Road here Archery Road Leave Paddys River Road here Scenic Road Leave Booroomba Road here Unnamed track off Booroomba Road Leave Tidbinbilla Road here Booroomba Road Leave Booroomba Road here Unnamed track off Booroomba Road Tidbinbilla Road Leave Tidbinbilla Road here Unnamed track off Tidbinbilla Road Leave Tidbinbilla Road here Unnamed track off Tidbinbilla Road
sealed road unsealed 4WD walking track and walk-in leave the road listed way in named nearby, not confirmed mapped approach, not confirmed access

Tap an access diamond, its walking line, to open the details on the map. Nearby items within the same click range open together.

A track shown here is not a guarantee of access — check current closures and gate status with the land manager before you rely on it, and ask where the way in crosses private ground. A meeting is counted where the mapped track comes within 250 m of the mapped channel.

When things happen

The guide's calendar for this water

When things happen

The year on this water

A year at a glance; check current rules

  • Early-season high water · Sep to Nov In our experience, deep nymphs in the slower water.
  • Dry-dropper season · Nov to Apr Once the river drops back, a dry with a nymph below it covers the runs and the pockets.
  • Hoppers on the tussock · Dec to Mar A good bet in summer is a hopper fished tight to the bank in the afternoon.

What the record shows

Flows, river gradient, changing water levels, fish surveys and stocking

What the record shows

The river's year

Daily flow at Paddy's River at Riverlea, every year 1957 to 2026

0.05 0.1 0.2 0.5 1 2 5 typical range high-flow mark Jan Feb Mar Apr May Jun Jul Aug Sep Oct Nov Dec m³/s latest 0.912 m³/s Recorded 2026-09-08 18:00: 0.912 m³/s
69 years of the gauge, week by week. The dark band is the middle half of all years, the pale band nine years in ten, the line the median. The orange dot, when shown, marks the latest available reading in the week it was taken. Compare it with the historical band for that week. The shaded strip is the typical range: the band the river sits in about half of all days. In a typical year the river sits in it from late October through the turn of the year to late July, and runs higher than that from early August to late October. Whether a given day is one to wade is a call made at the bank, not a reading off this chart. Median flow peaks in late August and bottoms out in early March.
Source: Bureau of Meteorology.
Source details and licence

Bureau of Meteorology — Water Data Online series catalogue (Snowy/Monaro stations). Bureau of Meteorology, © Commonwealth of Australia. Licensed from the Commonwealth of Australia under a Creative Commons Attribution 4.0 International licence. retrieved 2026-08-12.

How often it runs this high

24,496 days at Paddy's River at Riverlea, 1957 to 2026

0.05 0.1 0.2 0.5 1 2 5 10 20 typical range 0.097 to 0.612 m³/s high-flow mark 1.529 m³/s 0% of days 25% of days 50% of days 75% of days 100% of days m³/s
Read it left to right: the river runs above the flow on the left edge almost never, and above the flow on the right edge almost always. Half of all days sit below 0.4 m³/s. The shaded band is the typical range, where it sits about half the time; it runs higher than that one day in three and above the high-flow mark about one day in seven. These are frequency bands drawn from the record, not a measured limit — judge the water when you get there.
Source: Bureau of Meteorology.
Source details and licence

Bureau of Meteorology — Water Data Online series catalogue (Snowy/Monaro stations). Bureau of Meteorology, © Commonwealth of Australia. Licensed from the Commonwealth of Australia under a Creative Commons Attribution 4.0 International licence. retrieved 2026-08-12.

The fall of the river

Elevation along the river, source to end

Falls 273 m over 32 km, sand bed, floodplain pockets for much of its length.

480 617 753 gauge 410713 0 km from the source: 753 m · falling 3.2 m per km · sand, discontinuous floodplain 1 km from the source: 739 m · falling 5.7 m per km · sand, discontinuous floodplain 2 km from the source: 733 m · falling 6.5 m per km · sand, discontinuous floodplain 3 km from the source: 728 m · falling 8 m per km · sand, discontinuous floodplain 4 km from the source: 724 m · falling 9.6 m per km · sand, discontinuous floodplain 5 km from the source: 701 m · falling 9.5 m per km · gravel, discontinuous floodplain 6 km from the source: 694 m · falling 9.1 m per km · gravel, discontinuous floodplain 7 km from the source: 686 m · falling 8.9 m per km · sand, discontinuous floodplain 8 km from the source: 680 m · falling 8.3 m per km · sand, discontinuous floodplain 9 km from the source: 673 m · falling 8.1 m per km · sand, discontinuous floodplain 10 km from the source: 663 m · falling 8.3 m per km · sand, discontinuous floodplain 11 km from the source: 653 m · falling 8 m per km · sand, discontinuous floodplain 12 km from the source: 649 m · falling 7.7 m per km · sand, discontinuous floodplain 13 km from the source: 635 m · falling 7.3 m per km · sand, discontinuous floodplain 14 km from the source: 632 m · falling 6.5 m per km · sand, discontinuous floodplain 15 km from the source: 627 m · falling 6.1 m per km · sand, discontinuous floodplain 16 km from the source: 621 m · falling 5.8 m per km · sand, discontinuous floodplain 17 km from the source: 613 m · falling 5.1 m per km · sand, discontinuous floodplain 18 km from the source: 609 m · falling 4.7 m per km · sand, discontinuous floodplain 19 km from the source: 604 m · falling 4 m per km · sand, discontinuous floodplain 20 km from the source: 602 m · falling 3.8 m per km · sand, discontinuous floodplain 21 km from the source: 598 m · falling 4.3 m per km · sand, discontinuous floodplain 22 km from the source: 597 m · falling 6.3 m per km · sand, discontinuous floodplain 23 km from the source: 594 m · falling 8.6 m per km · gravel, occasional floodplain 24 km from the source: 583 m · falling 11 m per km · bedrock, gorge 25 km from the source: 569 m · falling 13.1 m per km · bedrock, gorge 26 km from the source: 541 m · falling 13.6 m per km · sand, discontinuous floodplain 27 km from the source: 536 m · falling 13.1 m per km · sand, discontinuous floodplain 28 km from the source: 525 m · falling 12.4 m per km · sand, discontinuous floodplain 29 km from the source: 509 m · falling 10.2 m per km · sand, discontinuous floodplain 30 km from the source: 500 m · falling 7.9 m per km · sand, discontinuous floodplain 31 km from the source: 491 m · falling 7.3 m per km · sand, discontinuous floodplain 32 km from the source: 480 m · falling 5.4 m per km · sand, discontinuous floodplain 0 km 8 km 16 km 24 km 32 km
bedrock · 6% gravel · 9% sand · 85%
Headwater
753 m
Outlet
480 m
Typical drop
8.5 m/km
Steepest sampled stretch
13.6 m/km, near 26 km
Hover the profile for the reading at any kilometre.
Source: Geoscience Australia.
Source details and licence

Geoscience Australia — 1 second SRTM-derived DEM-H v1.0 (NCI tile store). Geoscience Australia, 1 second SRTM-derived DEM-H v1.0, © Commonwealth of Australia, CC BY 4.0. retrieved 2026-08-16.

Bed material: NSW Department of Climate Change, Energy, the Environment and Water (Water, Surface Water Science).
Source details and licence

NSW River Styles spatial dataset — geomorphic character and dominant bed material. NSW River Styles spatial dataset, © State Government of NSW and NSW Department of Climate Change, Energy, the Environment and Water 2023. retrieved 2026-08-21.

Gauge pins identify the monitoring stations. The slope shows how steeply the river falls; it does not show rapids or safe wading routes.

The banks, seen from space

Land cover in the 120 m beside the water, Landsat 2023 to 2024 to 2025

0 to 5 km: woody open 11.3% 0 to 5 km: herbaceous native 53.1% 0 to 5 km: cultivated 35.6% 5 to 10 km: woody dense 3.1% 5 to 10 km: woody open 45.6% 5 to 10 km: woody sparse 2.5% 5 to 10 km: herbaceous native 47.5% 5 to 10 km: cultivated 1.3% 10 to 15 km: woody dense 0.6% 10 to 15 km: woody open 11.9% 10 to 15 km: herbaceous native 66.2% 10 to 15 km: cultivated 21.3% 15 to 20 km: woody open 30.6% 15 to 20 km: woody sparse 1.9% 15 to 20 km: herbaceous native 51.9% 15 to 20 km: cultivated 15.6% 20 to 25 km: woody dense 3.8% 20 to 25 km: woody open 26.3% 20 to 25 km: woody sparse 5% 20 to 25 km: herbaceous native 42.4% 20 to 25 km: cultivated 22.5% 25 to 30 km: woody dense 22.5% 25 to 30 km: woody open 76.9% 25 to 30 km: woody sparse 0.6% 30 to 32 km: woody open 95% 30 to 32 km: woody sparse 5% 0 km 10 km 20 km 30 km
dense forest open woodland scattered trees and scrub native grass and heath farmed or cleared bare ground lake
Along the river itself about 45% of the bank is under trees, 40% is native grass or heath and 15% is farmed. The most wooded stretch is 25 to 30 km from the source; the most open is 0 to 5 km. A satellite reads the canopy, not the ground beneath it, so treat this as a read of the country, not a survey of every bank.
Source: Geoscience Australia / Digital Earth Australia.
Source details and licence

DEA Land Cover (Landsat) — Level 4 classification, continental mosaics. © Commonwealth of Australia (Geoscience Australia). DEA Land Cover (Landsat), Digital Earth Australia. retrieved 2026-08-19.

Conditions

What the gauges say

Paddy's River at Riverlea

River flow

Above the seasonal median

0.912 m³/s

recorded 2026-09-08 18:00

Above the seasonal median

For the same week of the year

Lowest recorded
0.041 m³/s
Typical (median)
0.907 m³/s
Highest recorded
39.77 m³/s
About this reading

m³/s is the volume of water passing the gauge each second. A flow reading does not establish safe wading or a flood warning.

Daily averages for the same week of the year, from 1957-03-30 to 2026-08-22, across 65 years. The median is the middle reading: half are below it and half above. Recorded extremes are not safe-flow limits. The flow scale is compressed using log(1 + flow) so very large peaks and zero readings fit together.

Gauge height0.43 m Details

Height above the gauge's reference mark, not the depth where you will fish.

recorded 2026-09-08 18:00

These are automatic readings that have not been quality-checked, so treat them as a guide to the trend rather than exact figures.

Readings from the Bureau of Meteorology's Water Data Online, © Commonwealth of Australia, licensed CC BY 4.0. Gauge data supplied by © ACT (City and Environment Directorate). Nothing here is a forecast. Check the gauge before you rely on it.

Weather

What the sky is doing

Live weather for Paddy's River at Riverlea loads here. If it does not, check the Bureau of Meteorology forecast before you go.

Weather data by Open-Meteo.com

Questions anglers ask

Is the whole river trout water?

Yes. The ACT lists Paddys River and its catchment and tributaries as Trout Water, so the season, the fly-and-lure-only rule, the bait ban and the one-rod rule apply from the headwaters down.

How does it compare with the Cotter?

FlyLife's writers put the Cotter first and Paddys alongside the Naas as the other big water, particularly for deep nymphing. In our view, if you have one day, do the Cotter. If you have two, this is the second.

Behind this page