Australia Fly Guide
NSW · Central Tablelands

Macquarie River

Imagery © Esri

info

Before you rely on this page

  • Access here has not been confirmed on the ground — treat every way in as unverified.

The Macquarie is the Central Tablelands' native river. Between Bathurst and Burrendong Dam it runs as a string of rocky, cover-strewn pools joined by faster runs, and those pools fill with Murray cod and golden perch that push up from the dam when the water allows. You drive here for cod on a big fly.

The river has three parts, and a dam is the divide that matters. It begins where the Campbells and Fish rivers meet above Bathurst, runs through the town and down to Burrendong Dam, and that upper river is the water to plan around. The dam itself is a separate water. Below the wall the river carries on through Wellington and Dubbo, spreads into the Macquarie Marshes and reaches the Barwon near Brewarrina; for that long plains river, note the closed water at South Dubbo Weir.

The easiest trip is the town water. Bathurst is where bait fishing is popular; a local fishing site names the parks at Eglinton, just downstream, as water with a little less pressure. Fish a bead-head Woolly Bugger along the rock and the cover for golden perch and cod, and check the current NSW rules for both before you go, for any cod closed season and for the size and bag limits; trout cod are named among the river's fish, so check the current protected list too.

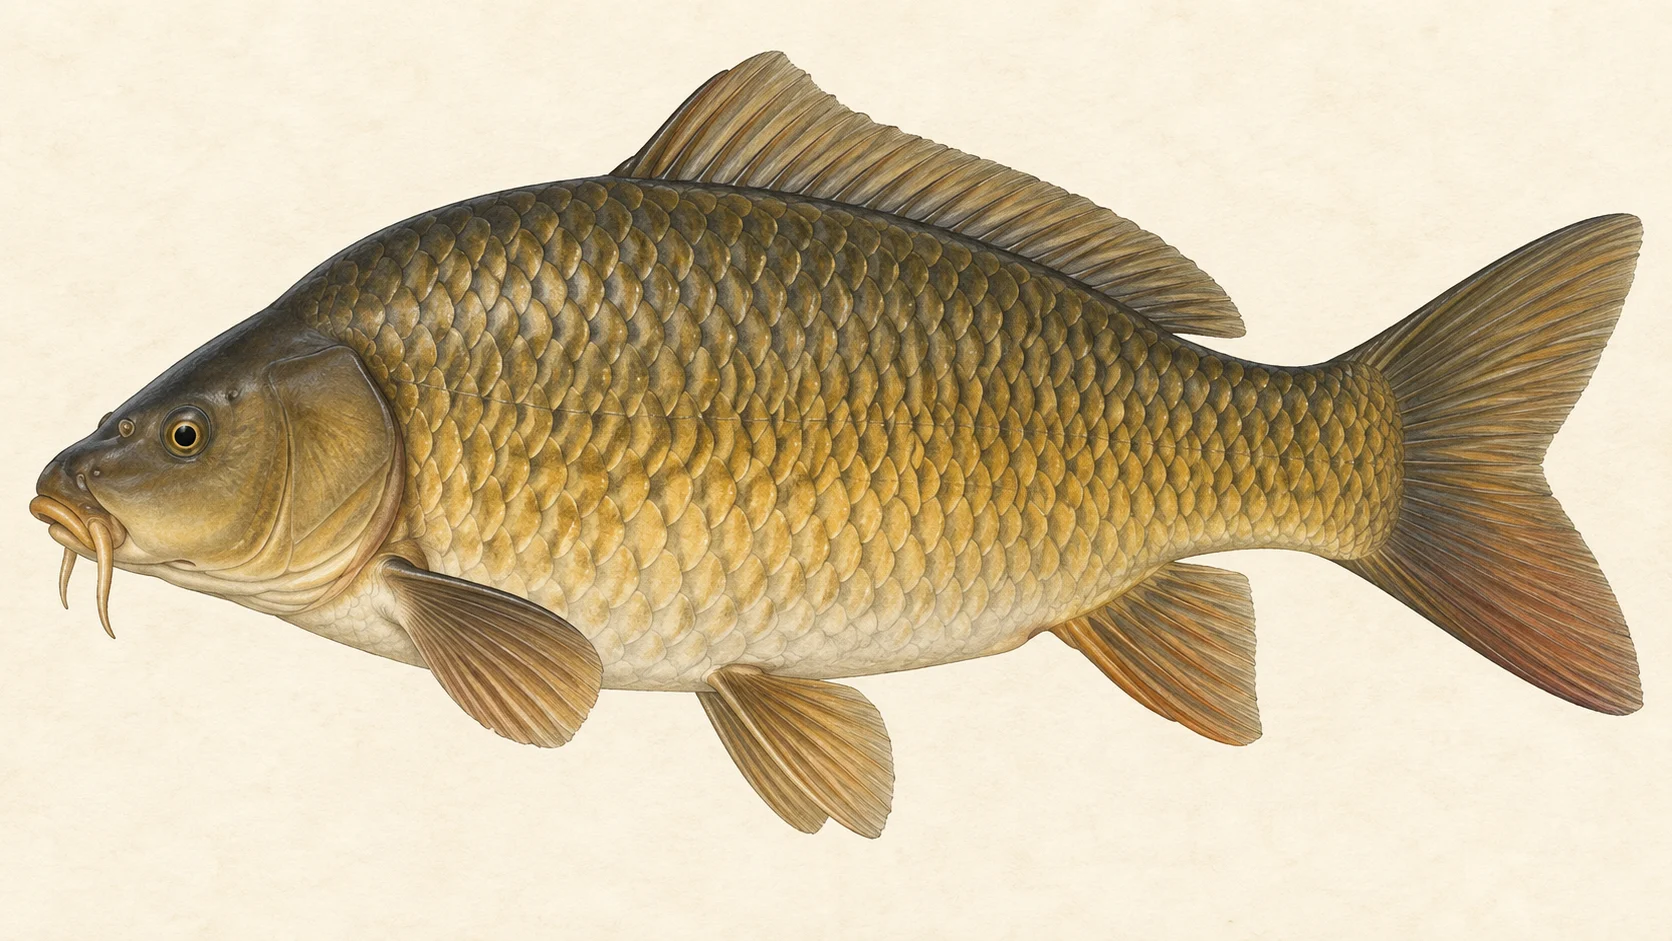
The second trip is the river below Bathurst for carp. The water there is often gin-clear, and in our experience a plain nymph landed in front of a feeding carp is a good bet. It is the fishing that keeps a slow cod day honest.

The third trip is trout, and the listed trout waters are the tributaries, not the main river. All the tributaries of the Macquarie upstream of and including Lewis Ponds Creek are listed general trout waters, so check the current NSW fishing guide for the trout season and limits before you fish them; rainbows are described as the usual target upstream of Burrendong. The Macquarie itself is left out of that listing.

Check the current NSW rules for cod, then pick a pool with rock and cover and fish it slowly.

Water and habitat

The Macquarie starts above Bathurst where the Campbells and Fish rivers join. From a spot near Bathurst known as The Forge down to where the river enters Burrendong Dam, it becomes a succession of rocky pools strewn with cover, joined by faster runs. The pools are where the natives sit, and they are well populated with fish that migrate up out of the dam when the levels let them.

That migration is the thing to understand. In our reading, the fishing in the pools rises and falls with the dam: water that lets fish up from the lake is good news, and a long dry spell likely leaves the pools to the fish already in them. The live card lists the river's many gauges; check the one nearest the stretch you plan to fish.

The gradient profile shows the fall from the tablelands to the plains. The steeper fall, over gravel with stretches of bedrock, sits in the upper river; downstream the profile flattens into a long plains river with a sandy, then fine bed. The bank cover chart describes the corridor's vegetation, and it is worth a glance before you pick a stretch, because cod hold under shade and timber and goldens hold against rock.

Below the dam the river is a different animal: a plains river running past Wellington and Dubbo and out into the marshes.

Fish and forage

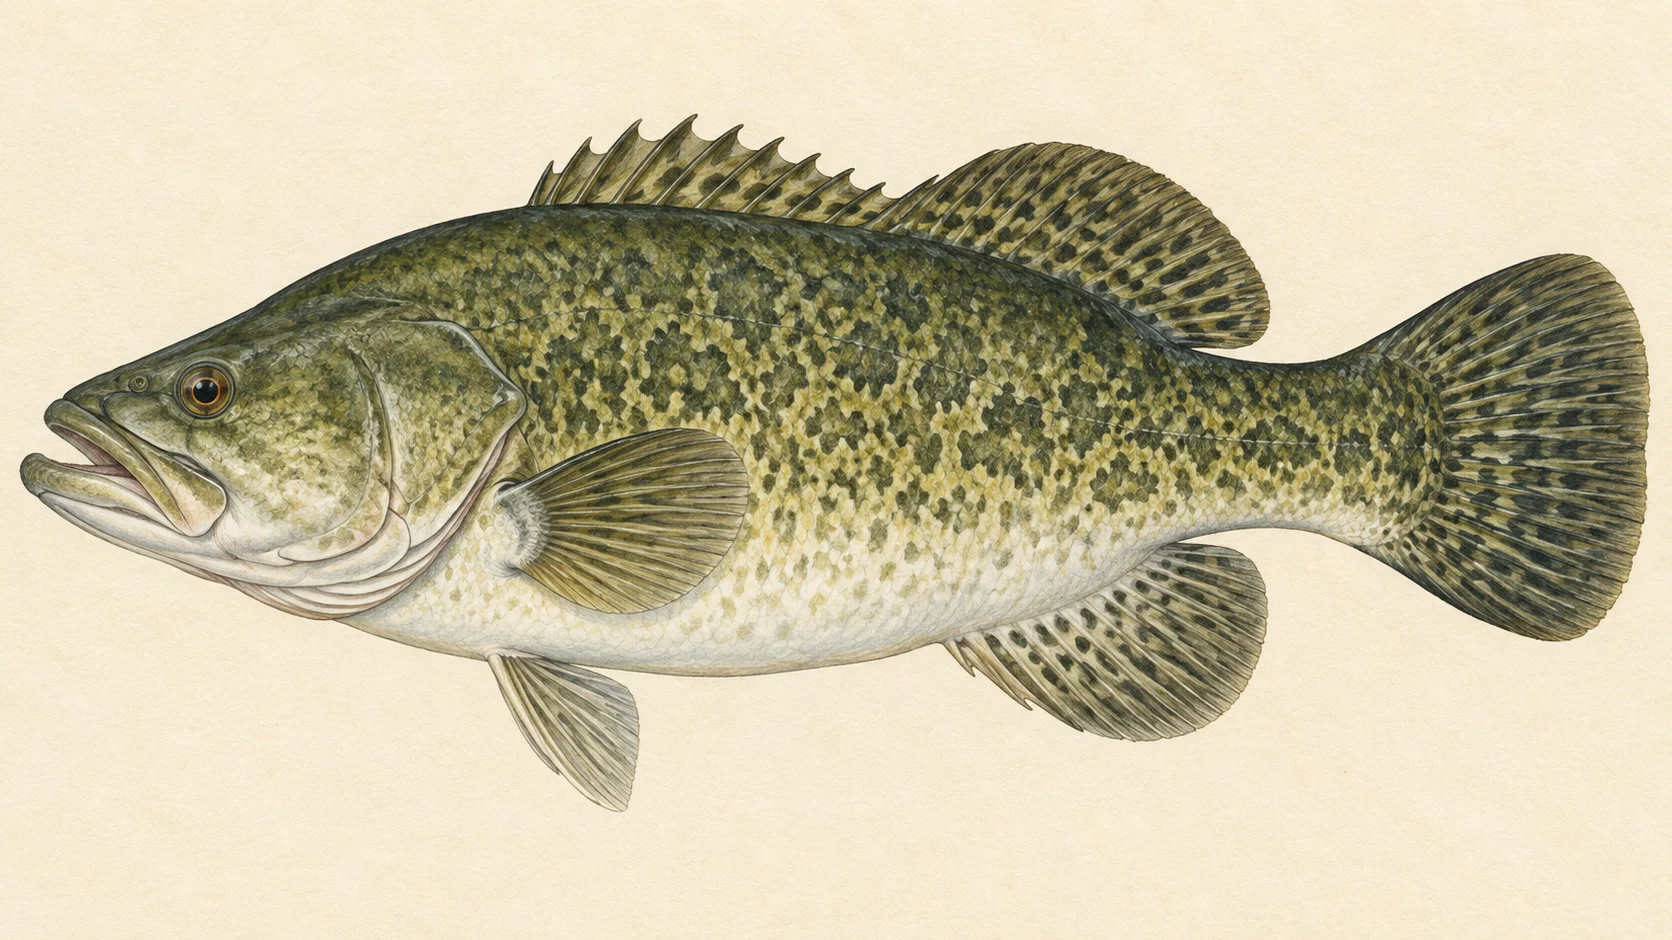
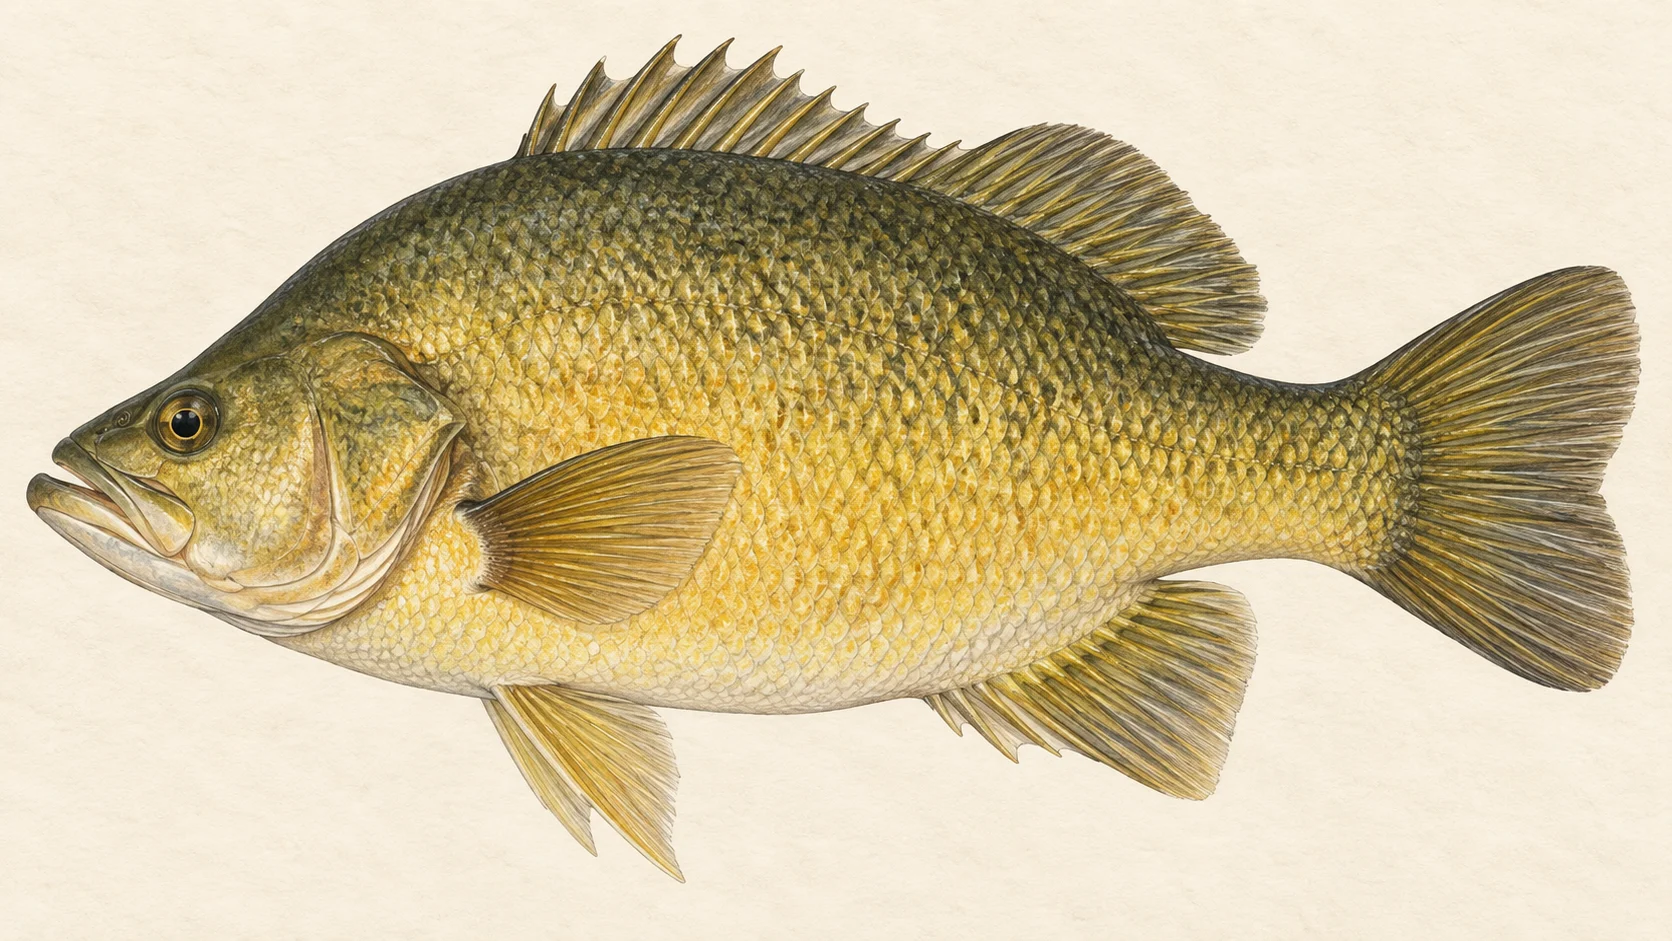
Murray cod and golden perch are the most prolific fish here, and especially so near Burrendong. Both are stocked, as the release chart shows, and a Central West guide writes of many more cod and yellowbelly in the river than in earlier years. A FlyLife writer who grew up in Bathurst admits to leaving the cod fishery on the doorstep alone as a boy, and to being hooked after a first cod on fly near the town.

Silver perch live in the lower river and near the impoundments. River blackfish and trout cod are here too; a trout cod looks enough like a small Murray cod that you should know the difference before you fish, and check the current protected list in the NSW rules.

Rainbow trout and brown trout are the introduced salmonids, and rainbows are described as the usual trout target upstream of Burrendong. A FlyLife writer records a small brown from the river in Bathurst itself, so trout do turn up in the main river, but the listed trout waters are the tributaries.

European carp are plentiful and, below Bathurst, often in water clear enough to sight-fish. Redfin are recorded too.

The forage is small fish. Australian smelt, bony bream, Murray River rainbowfish, unspecked hardyheads, flathead gudgeons and carp gudgeons are all recorded, with goldfish and gambusia in the mix. That points to a bead-head Woolly Bugger in black or olive, size 4 to 8, as the searching fly, a sparse baitfish pattern for goldens, and a big bulky fly with a heavy hook for cod.

When to fish it

The warm months are the native season. In our experience cod and golden perch feed hardest from late spring through autumn, at dawn, dusk and after dark, and the surface fishing for cod is a warm-water game. Check the current NSW rules for any Murray cod closed season and fish for them only when the season is open.

Since the goldens push up from Burrendong when levels allow, a good bet after a rise is to fish the pools closest to the dam first.

Carp fish best in low, clear water through the warm months, when you can see them working the edges below Bathurst. For trout in the listed tributaries, check the current NSW fishing guide for the season dates.

Winter is slow for everything, in our experience. The natives go deep and quiet, and the carp are the only fish likely to show themselves on a warm afternoon.

How to fish it

For goldens, fish a bead-head Woolly Bugger on a six- or seven-weight with a floating or intermediate line. Cast to the head of a rocky pool, let the fly sink to the bottom, and bring it back in short strips with long pauses along the face of the rock and past every piece of cover. Goldens take on the drop, so watch the line. Move pool to pool; a pool with no take in twenty casts is usually a pool with no fish in it that day.

For cod, step up to an eight- or nine-weight, a sink-tip and a large, bulky fly, and read the cover the way that page describes: cast tight to timber, rock ledges and shade, let it get down, and strip slowly. Fish heavy tippet, because a cod goes straight back into the cover it came from. Low light is your friend, and on a summer night a big surface fly walked across a pool is how cod are taken on top.

For carp, walk the edges below Bathurst on a bright, calm day with polarised glasses. Find a fish that is feeding rather than cruising, put a plain unweighted nymph a metre ahead of it, and lift gently when the fish tips on the fly. A five-weight is enough, with a strong leader.

For the trout tributaries, fish them as small tablelands streams: a four-weight, a dry-dropper, and an upstream approach. That is a different trip.

Carry forceps, a big net and a soft mat for cod, keep the fish in the water while you unhook it, and let it swim off under its own power. Check, clean and dry your gear before the next river.

Access and safety

The access card names the angler access sites and boat ramps along the river, and there are a great many. Bathurst is the town water, where bait fishing is popular. A local fishing site names the parks at Eglinton, just downstream, as water with a little less pressure, and in our view it is where a first visit belongs.

Off the beaten track, the Bridle Trail is a historic 4WD-only route from Hill End to Bathurst that runs alongside the Macquarie and the Turon, with six camping sites along it. The rivers cannot be reached for the full length of the track, so do not assume every camp is on the water. Check current track conditions and take a real 4WD; it is not a road for a family car.

Away from the parks, do not assume the bank is open to you; ask at the house before you cross a fence.

Treat every pool as deep and every rock as slippery, and remember that, as on any hill-country river, the water can rise after a storm. Do not wade a coloured river you cannot see the bottom of, and if the gauges show a rise, fish the edges from the bank. As on any bush river in summer, watch where you put your hands and feet on warm rocks.

Regulations

No rule was found that applies to the whole river. Three water-specific items from the NSW fishing authority touch its tributaries or parts of it.

First, the trout listing. The NSW fishing guide for the Central Tablelands and the state's trout and salmon closure notification list all tributaries of the Macquarie River, but not the Macquarie itself, upstream of and including its junction with Lewis Ponds Creek as general trout waters. Check the current guide for the trout season and limits on those tributaries; the river itself is not in the listing.

Second and third, two standing closed-waters notices. One at Burrendong Dam and one at South Dubbo Weir prohibit fishing by any method in the water each notice describes. Read the current notices for their exact extent before you fish near either.

Murray cod, golden perch and the trout are covered by statewide NSW rules for size, bag and any closed season; confirm the current protected list before you fish. Those rules change, so before you leave open the current NSW fishing rules and regulations, confirm the fishing fee and exemptions and check the freshwater bag and size limits, including the cod and trout season dates.
110 named access sites

These authority-listed points are separate from the mapped track intersections above. Some were inspected and some are public boat-ramp records; each row says which. A listing does not grant permission across private land, so check closures, signs and gates when you arrive.

Showing the first 60 of 110 sites on this long river. Use the authority sources below for the complete lists.

Sources: NSW Department of Primary Industries and Regional Development; Transport for NSW.

When things happen

The guide's calendar for this water

When things happen

The year on this water

A year at a glance; check current rules

  • Murray cod on the rocky pools · Dec to Apr The warm months are when cod feed hardest in the pools between Bathurst and Burrendong. Check the current NSW rules for any cod closed season before you fish for them.
  • Golden perch in the runs and pools · Oct to Apr Goldens push up from Burrendong when the levels allow and hold in the cover-strewn pools. A weighted Woolly Bugger fished slow along the rock is the plain approach.
  • Sight-cast carp downstream of Bathurst · Oct to Mar Clear, low water through the warm months lets you see carp feeding along the edges below town. A plain nymph and a long lead is the whole method.
  • Small baitfish and gudgeons · Jan to Dec Smelt, bony bream, rainbowfish, hardyheads and carp gudgeons are recorded in the river. A sparse baitfish pattern and a dark Woolly Bugger cover them.

What the record shows

Flows, river gradient, changing water levels, fish surveys and stocking

What the record shows

The river's year

Daily flow at Macquarie River at Gin Gin, every year 1980 to 2026

1 2 5 10 20 50 100 typical range high-flow mark Jan Feb Mar Apr May Jun Jul Aug Sep Oct Nov Dec m³/s
47 years of the gauge, week by week. The dark band is the middle half of all years, the pale band nine years in ten, the line the median. The shaded strip is the typical range: the band the river sits in about half of all days. In a typical year the river sits in it from mid February to mid September, and runs higher than that from early December through the turn of the year to early February. Whether a given day is one to wade is a call made at the bank, not a reading off this chart. Median flow peaks in early January and bottoms out in late May. Flow and temperature are measured at different stations; this chart shows flow only.
Source: Bureau of Meteorology.
Source details and licence

Bureau of Meteorology — Water Data Online series catalogue (Snowy/Monaro stations). Bureau of Meteorology, © Commonwealth of Australia. Licensed from the Commonwealth of Australia under a Creative Commons Attribution 4.0 International licence. retrieved 2026-08-12.

How often it runs this high

16,912 days at Macquarie River at Gin Gin, 1980 to 2026

0.05 0.1 0.2 0.5 1 2 5 10 20 50 100 200 500 typical range 3.038 to 18.953 m³/s high-flow mark 39.76 m³/s 0% of days 25% of days 50% of days 75% of days 100% of days m³/s
Read it left to right: the river runs above the flow on the left edge almost never, and above the flow on the right edge almost always. Half of all days sit below 11 m³/s. The shaded band is the typical range, where it sits about half the time; it runs higher than that one day in three and above the high-flow mark about one day in seven. These are frequency bands drawn from the record, not a measured limit — judge the water when you get there.
Source: Bureau of Meteorology.
Source details and licence

Bureau of Meteorology — Water Data Online series catalogue (Snowy/Monaro stations). Bureau of Meteorology, © Commonwealth of Australia. Licensed from the Commonwealth of Australia under a Creative Commons Attribution 4.0 International licence. retrieved 2026-08-12.

The fall of the river

Elevation along the river, source to end

Falls 547 m over 894.7 km, fine-grained bed, floodplain pockets for much of its length.

120 393 666 gauge 421191 gauge 421192 gauge 421040 gauge 421900 gauge 421127 gauge 421031 gauge 421090 gauge 421022 gauge 421116 gauge 421147 gauge 421135 gauge 421012 gauge 421907 0 km from the source: 666 m · falling 0.4 m per km · gravel, discontinuous floodplain 2.99 km from the source: 663 m · falling 0.6 m per km · gravel, discontinuous floodplain 5.98 km from the source: 659 m · falling 0.8 m per km · gravel, discontinuous floodplain 8.98 km from the source: 658 m · falling 0.9 m per km · gravel, discontinuous floodplain 11.97 km from the source: 656 m · falling 1 m per km · gravel, discontinuous floodplain 14.96 km from the source: 651 m · falling 1 m per km · gravel, discontinuous floodplain 17.95 km from the source: 647 m · falling 1 m per km · gravel, discontinuous floodplain 20.95 km from the source: 646 m · falling 1 m per km · gravel, discontinuous floodplain 23.94 km from the source: 643 m · falling 1.1 m per km · sand, occasional floodplain 26.93 km from the source: 640 m · falling 1.2 m per km · gravel, discontinuous floodplain 29.92 km from the source: 636 m · falling 1.4 m per km · sand, discontinuous floodplain 32.92 km from the source: 631 m · falling 1.6 m per km · gravel, discontinuous floodplain 35.91 km from the source: 626 m · falling 1.7 m per km · gravel, discontinuous floodplain 38.9 km from the source: 622 m · falling 1.8 m per km · gravel, discontinuous floodplain 41.89 km from the source: 615 m · falling 1.8 m per km · gravel, discontinuous floodplain 44.89 km from the source: 607 m · falling 1.6 m per km · gravel, occasional floodplain 47.88 km from the source: 607 m · falling 1.5 m per km · gravel, occasional floodplain 50.87 km from the source: 600 m · falling 1.5 m per km · variable 53.86 km from the source: 596 m · falling 1.5 m per km · gravel, occasional floodplain 56.85 km from the source: 593 m · falling 1.6 m per km · gravel, occasional floodplain 59.85 km from the source: 588 m · falling 1.9 m per km · gravel, occasional floodplain 62.84 km from the source: 581 m · falling 2.1 m per km · gravel, occasional floodplain 65.83 km from the source: 577 m · falling 2.5 m per km · gravel, occasional floodplain 68.82 km from the source: 566 m · falling 3 m per km · gravel, occasional floodplain 71.82 km from the source: 556 m · falling 3.6 m per km · gravel, discontinuous floodplain 74.81 km from the source: 554 m · falling 4.2 m per km · gravel, discontinuous floodplain 77.8 km from the source: 533 m · falling 4.7 m per km · gravel, discontinuous floodplain 80.79 km from the source: 514 m · falling 4.7 m per km · gravel, discontinuous floodplain 83.79 km from the source: 495 m · falling 4.3 m per km · gravel, discontinuous floodplain 86.78 km from the source: 483 m · falling 3.7 m per km · gravel, discontinuous floodplain 89.77 km from the source: 478 m · falling 3 m per km · gravel, discontinuous floodplain 92.76 km from the source: 474 m · falling 2.5 m per km · gravel, discontinuous floodplain 95.76 km from the source: 467 m · falling 2.3 m per km · gravel, discontinuous floodplain 98.75 km from the source: 454 m · falling 2.3 m per km · gravel, discontinuous floodplain 101.74 km from the source: 449 m · falling 2.3 m per km · bedrock, gorge 104.73 km from the source: 448 m · falling 2.4 m per km · gravel, discontinuous floodplain 107.72 km from the source: 441 m · falling 2.6 m per km · gravel, discontinuous floodplain 110.72 km from the source: 428 m · falling 2.7 m per km · gravel, discontinuous floodplain 113.71 km from the source: 419 m · falling 2.7 m per km · gravel, discontinuous floodplain 116.7 km from the source: 415 m · falling 2.7 m per km · gravel, occasional floodplain 119.69 km from the source: 402 m · falling 2.4 m per km · gravel, occasional floodplain 122.69 km from the source: 397 m · falling 2.1 m per km · gravel, occasional floodplain 125.68 km from the source: 391 m · falling 1.9 m per km · gravel, occasional floodplain 128.67 km from the source: 387 m · falling 1.7 m per km · bedrock, gorge 131.66 km from the source: 384 m · falling 1.5 m per km · bedrock, gorge 134.66 km from the source: 377 m · falling 1.3 m per km · gravel, discontinuous floodplain 137.65 km from the source: 374 m · falling 1.2 m per km · bedrock, gorge 140.64 km from the source: 368 m · falling 1 m per km · bedrock, gorge 143.63 km from the source: 366 m · falling 0.9 m per km · bedrock, gorge 146.63 km from the source: 372 m · falling 0.9 m per km · bedrock, gorge 149.62 km from the source: 364 m · falling 1.1 m per km · bedrock, gorge 152.61 km from the source: 358 m · falling 1.2 m per km · bedrock, gorge 155.6 km from the source: 358 m · falling 1.2 m per km · gravel, discontinuous floodplain 158.59 km from the source: 351 m · falling 1 m per km · gravel, discontinuous floodplain 161.59 km from the source: 347 m · falling 0.7 m per km · water storage 164.58 km from the source: 344 m · falling 0.4 m per km · water storage 167.57 km from the source: 348 m · falling 0.4 m per km · water storage 170.56 km from the source: 355 m · falling 0.4 m per km · water storage 173.56 km from the source: 341 m · falling 0.5 m per km · water storage 176.55 km from the source: 344 m · falling 0.5 m per km · water storage 179.54 km from the source: 339 m · falling 0.4 m per km · water storage 182.53 km from the source: 342 m · falling 0.3 m per km · water storage 185.53 km from the source: 342 m · falling 0.1 m per km · water storage 188.52 km from the source: 339 m · falling 0.1 m per km · water storage 191.51 km from the source: 342 m · falling 0 m per km · water storage 194.5 km from the source: 340 m · falling 0 m per km · water storage 197.49 km from the source: 342 m · falling -0.1 m per km · water storage 200.49 km from the source: 340 m · falling -0.1 m per km · water storage 203.48 km from the source: 342 m · falling -0.1 m per km · water storage 206.47 km from the source: 342 m · falling 0.6 m per km · water storage 209.46 km from the source: 342 m · falling 1.2 m per km · water storage 212.46 km from the source: 342 m · falling 1.9 m per km · water storage 215.45 km from the source: 341 m · falling 2.6 m per km · gravel, discontinuous floodplain 218.44 km from the source: 305 m · falling 2.7 m per km · gravel, discontinuous floodplain 221.43 km from the source: 304 m · falling 2.2 m per km · sand, discontinuous floodplain 224.43 km from the source: 304 m · falling 1.8 m per km · gravel, discontinuous floodplain 227.42 km from the source: 300 m · falling 1.3 m per km · gravel, discontinuous floodplain 230.41 km from the source: 297 m · falling 0.7 m per km · gravel, discontinuous floodplain 233.4 km from the source: 296 m · falling 0.6 m per km · gravel, discontinuous floodplain 236.4 km from the source: 293 m · falling 0.6 m per km · gravel, discontinuous floodplain 239.39 km from the source: 292 m · falling 0.5 m per km · gravel, discontinuous floodplain 242.38 km from the source: 291 m · falling 0.5 m per km · gravel, discontinuous floodplain 245.37 km from the source: 290 m · falling 0.5 m per km · gravel, discontinuous floodplain 248.36 km from the source: 287 m · falling 0.5 m per km · gravel, discontinuous floodplain 251.36 km from the source: 288 m · falling 0.5 m per km · gravel, discontinuous floodplain 254.35 km from the source: 283 m · falling 0.5 m per km · gravel, discontinuous floodplain 257.34 km from the source: 283 m · falling 0.4 m per km · gravel, discontinuous floodplain 260.33 km from the source: 282 m · falling 0.3 m per km · gravel, discontinuous floodplain 263.33 km from the source: 281 m · falling 0.3 m per km · gravel, discontinuous floodplain 266.32 km from the source: 282 m · falling 0.2 m per km · gravel, discontinuous floodplain 269.31 km from the source: 280 m · falling 0.2 m per km · gravel, discontinuous floodplain 272.3 km from the source: 281 m · falling 0.3 m per km · gravel, discontinuous floodplain 275.3 km from the source: 279 m · falling 0.4 m per km · gravel, discontinuous floodplain 278.29 km from the source: 276 m · falling 0.5 m per km · gravel, discontinuous floodplain 281.28 km from the source: 279 m · falling 0.5 m per km · gravel, discontinuous floodplain 284.27 km from the source: 275 m · falling 0.6 m per km · gravel, discontinuous floodplain 287.27 km from the source: 270 m · falling 0.5 m per km · gravel, discontinuous floodplain 290.26 km from the source: 270 m · falling 0.4 m per km · gravel, discontinuous floodplain 293.25 km from the source: 269 m · falling 0.4 m per km · gravel, discontinuous floodplain 296.24 km from the source: 271 m · falling 0.3 m per km · gravel, discontinuous floodplain 299.23 km from the source: 269 m · falling 0.4 m per km · gravel, discontinuous floodplain 302.23 km from the source: 267 m · falling 0.5 m per km · gravel, discontinuous floodplain 305.22 km from the source: 265 m · falling 0.5 m per km · gravel, discontinuous floodplain 308.21 km from the source: 264 m · falling 0.5 m per km · gravel, discontinuous floodplain 311.2 km from the source: 261 m · falling 0.4 m per km · gravel, discontinuous floodplain 314.2 km from the source: 260 m · falling 0.3 m per km · gravel, discontinuous floodplain 317.19 km from the source: 260 m · falling 0.2 m per km · gravel, discontinuous floodplain 320.18 km from the source: 261 m · falling 0.3 m per km · gravel, discontinuous floodplain 323.17 km from the source: 259 m · falling 0.3 m per km · gravel, discontinuous floodplain 326.17 km from the source: 258 m · falling 0.3 m per km · gravel, discontinuous floodplain 329.16 km from the source: 258 m · falling 0.3 m per km · gravel, discontinuous floodplain 332.15 km from the source: 256 m · falling 0.4 m per km · gravel, discontinuous floodplain 335.14 km from the source: 254 m · falling 0.3 m per km · gravel, discontinuous floodplain 338.14 km from the source: 256 m · falling 0.3 m per km · gravel, discontinuous floodplain 341.13 km from the source: 252 m · falling 0.3 m per km · sand, discontinuous floodplain 344.12 km from the source: 251 m · falling 0.2 m per km · sand, discontinuous floodplain 347.11 km from the source: 253 m · falling 0.2 m per km · sand, discontinuous floodplain 350.1 km from the source: 251 m · falling 0.3 m per km · sand, discontinuous floodplain 353.1 km from the source: 252 m · falling 0.2 m per km · sand, discontinuous floodplain 356.09 km from the source: 250 m · falling 0.2 m per km · sand, discontinuous floodplain 359.08 km from the source: 247 m · falling 0.3 m per km · sand, discontinuous floodplain 362.07 km from the source: 248 m · falling 0.2 m per km · sand, discontinuous floodplain 365.07 km from the source: 251 m · falling 0.3 m per km · sand, discontinuous floodplain 368.06 km from the source: 247 m · falling 0.3 m per km · sand, discontinuous floodplain 371.05 km from the source: 246 m · falling 0.2 m per km · sand, valley fill 374.04 km from the source: 244 m · falling 0.2 m per km · sand, valley fill 377.04 km from the source: 244 m · falling 0.3 m per km · sand, discontinuous floodplain 380.03 km from the source: 247 m · falling 0.2 m per km · sand, discontinuous floodplain 383.02 km from the source: 246 m · falling 0.4 m per km 386.01 km from the source: 242 m · falling 0.5 m per km · sand, discontinuous floodplain 389.01 km from the source: 238 m · falling 0.5 m per km · sand, discontinuous floodplain 392 km from the source: 242 m · falling 0.5 m per km · sand, discontinuous floodplain 394.99 km from the source: 236 m · falling 0.5 m per km · sand, discontinuous floodplain 397.98 km from the source: 237 m · falling 0.4 m per km · sand, discontinuous floodplain 400.97 km from the source: 237 m · falling 0.4 m per km · sand, discontinuous floodplain 403.97 km from the source: 232 m · falling 0.4 m per km · sand, discontinuous floodplain 406.96 km from the source: 232 m · falling 0.2 m per km · sand, discontinuous floodplain 409.95 km from the source: 231 m · falling 0.1 m per km · fine-grained, valley fill 412.94 km from the source: 235 m · falling 0.1 m per km · sand, discontinuous floodplain 415.94 km from the source: 233 m · falling 0.1 m per km · sand, discontinuous floodplain 418.93 km from the source: 233 m · falling 0.2 m per km · sand, discontinuous floodplain 421.92 km from the source: 230 m · falling 0.3 m per km · sand, discontinuous floodplain 424.91 km from the source: 230 m · falling 0.2 m per km · sand, discontinuous floodplain 427.91 km from the source: 229 m · falling 0.1 m per km · sand, discontinuous floodplain 430.9 km from the source: 227 m · falling 0.1 m per km · sand, discontinuous floodplain 433.89 km from the source: 230 m · falling 0 m per km · sand, discontinuous floodplain 436.88 km from the source: 231 m · falling 0.1 m per km · sand, discontinuous floodplain 439.88 km from the source: 230 m · falling 0.1 m per km · sand, discontinuous floodplain 442.87 km from the source: 229 m · falling 0.2 m per km · sand, discontinuous floodplain 445.86 km from the source: 226 m · falling 0.2 m per km · sand, discontinuous floodplain 448.85 km from the source: 228 m · falling 0.3 m per km · sand, discontinuous floodplain 451.84 km from the source: 227 m · falling 0.2 m per km · sand, discontinuous floodplain 454.84 km from the source: 226 m · falling 0.3 m per km · sand, discontinuous floodplain 457.83 km from the source: 225 m · falling 0.3 m per km · sand, discontinuous floodplain 460.82 km from the source: 223 m · falling 0.3 m per km · sand, discontinuous floodplain 463.81 km from the source: 224 m · falling 0.3 m per km · sand, discontinuous floodplain 466.81 km from the source: 221 m · falling 0.5 m per km · sand, discontinuous floodplain 469.8 km from the source: 220 m · falling 0.5 m per km · sand, discontinuous floodplain 472.79 km from the source: 221 m · falling 0.6 m per km · sand, discontinuous floodplain 475.78 km from the source: 218 m · falling 0.7 m per km · sand, discontinuous floodplain 478.78 km from the source: 211 m · falling 0.6 m per km · sand, discontinuous floodplain 481.77 km from the source: 211 m · falling 0.5 m per km · sand, discontinuous floodplain 484.76 km from the source: 214 m · falling 0.4 m per km · sand, discontinuous floodplain 487.75 km from the source: 209 m · falling 0.3 m per km · sand, discontinuous floodplain 490.74 km from the source: 209 m · falling 0.1 m per km · sand, discontinuous floodplain 493.74 km from the source: 211 m · falling 0.2 m per km · sand, discontinuous floodplain 496.73 km from the source: 210 m · falling 0.2 m per km · sand, discontinuous floodplain 499.72 km from the source: 209 m · falling 0.2 m per km · sand, discontinuous floodplain 502.71 km from the source: 207 m · falling 0.3 m per km · fine-grained 505.71 km from the source: 206 m · falling 0.3 m per km · fine-grained 508.7 km from the source: 206 m · falling 0.3 m per km · fine-grained 511.69 km from the source: 206 m · falling 0.3 m per km · fine-grained 514.68 km from the source: 204 m · falling 0.3 m per km · fine-grained 517.68 km from the source: 203 m · falling 0.3 m per km · fine-grained 520.67 km from the source: 203 m · falling 0.2 m per km · fine-grained 523.66 km from the source: 203 m · falling 0.3 m per km · fine-grained 526.65 km from the source: 201 m · falling 0.3 m per km · fine-grained 529.65 km from the source: 200 m · falling 0.2 m per km · fine-grained 532.64 km from the source: 200 m · falling 0.2 m per km · fine-grained 535.63 km from the source: 198 m · falling 0.2 m per km · fine-grained 538.62 km from the source: 199 m · falling 0.1 m per km · fine-grained 541.61 km from the source: 200 m · falling 0.1 m per km · fine-grained 544.61 km from the source: 197 m · falling 0.1 m per km · fine-grained 547.6 km from the source: 198 m · falling 0.2 m per km · fine-grained 550.59 km from the source: 196 m · falling 0.2 m per km · fine-grained 553.58 km from the source: 197 m · falling 0.3 m per km · fine-grained 556.58 km from the source: 196 m · falling 0.3 m per km · fine-grained 559.57 km from the source: 194 m · falling 0.3 m per km · fine-grained 562.56 km from the source: 193 m · falling 0.3 m per km · fine-grained, discontinuous floodplain 565.55 km from the source: 192 m · falling 0.2 m per km · fine-grained 568.55 km from the source: 191 m · falling 0.2 m per km · fine-grained 571.54 km from the source: 192 m · falling 0.1 m per km · fine-grained 574.53 km from the source: 192 m · falling 0.2 m per km · fine-grained 577.52 km from the source: 191 m · falling 0.1 m per km · fine-grained 580.52 km from the source: 190 m · falling 0.2 m per km · fine-grained 583.51 km from the source: 189 m · falling 0.2 m per km · fine-grained 586.5 km from the source: 189 m · falling 0.1 m per km · fine-grained 589.49 km from the source: 192 m · falling 0.1 m per km · fine-grained 592.48 km from the source: 188 m · falling 0.1 m per km · fine-grained 595.48 km from the source: 187 m · falling 0.1 m per km · fine-grained 598.47 km from the source: 190 m · falling 0.2 m per km · fine-grained 601.46 km from the source: 187 m · falling 0.3 m per km · fine-grained 604.45 km from the source: 188 m · falling 0.3 m per km · fine-grained 607.45 km from the source: 184 m · falling 0.3 m per km · fine-grained 610.44 km from the source: 185 m · falling 0.3 m per km · fine-grained 613.43 km from the source: 183 m · falling 0.3 m per km · fine-grained 616.42 km from the source: 182 m · falling 0.3 m per km · fine-grained 619.42 km from the source: 184 m · falling 0.2 m per km · fine-grained 622.41 km from the source: 182 m · falling 0.3 m per km · fine-grained 625.4 km from the source: 180 m · falling 0.3 m per km · fine-grained 628.39 km from the source: 179 m · falling 0.3 m per km · fine-grained 631.39 km from the source: 179 m · falling 0.3 m per km · fine-grained 634.38 km from the source: 179 m · falling 0.2 m per km · fine-grained 637.37 km from the source: 178 m · falling 0.2 m per km · fine-grained, valley fill 640.36 km from the source: 177 m · falling 0.2 m per km · fine-grained 643.35 km from the source: 177 m · falling 0.2 m per km · fine-grained 646.35 km from the source: 176 m · falling 0.2 m per km · fine-grained 649.34 km from the source: 176 m · falling 0.2 m per km · fine-grained 652.33 km from the source: 175 m · falling 0.3 m per km · fine-grained 655.32 km from the source: 175 m · falling 0.3 m per km · fine-grained 658.32 km from the source: 173 m · falling 0.3 m per km · fine-grained 661.31 km from the source: 172 m · falling 0.3 m per km · fine-grained 664.3 km from the source: 170 m · falling 0.3 m per km · fine-grained 667.29 km from the source: 171 m · falling 0.3 m per km · fine-grained 670.29 km from the source: 170 m · falling 0.3 m per km · fine-grained 673.28 km from the source: 169 m · falling 0.3 m per km · fine-grained 676.27 km from the source: 167 m · falling 0.2 m per km · fine-grained 679.26 km from the source: 168 m · falling 0.2 m per km · fine-grained 682.26 km from the source: 166 m · falling 0.2 m per km · fine-grained 685.25 km from the source: 165 m · falling 0.2 m per km · fine-grained 688.24 km from the source: 167 m · falling 0.2 m per km · fine-grained 691.23 km from the source: 165 m · falling 0.2 m per km · fine-grained 694.22 km from the source: 164 m · falling 0.1 m per km · fine-grained 697.22 km from the source: 165 m · falling 0.1 m per km · fine-grained 700.21 km from the source: 164 m · falling 0.2 m per km · fine-grained 703.2 km from the source: 163 m · falling 0.2 m per km · fine-grained 706.19 km from the source: 163 m · falling 0.2 m per km · fine-grained 709.19 km from the source: 162 m · falling 0.3 m per km · fine-grained 712.18 km from the source: 162 m · falling 0.3 m per km · fine-grained 715.17 km from the source: 158 m · falling 0.3 m per km · fine-grained 718.16 km from the source: 160 m · falling 0.3 m per km · fine-grained 721.16 km from the source: 160 m · falling 0.3 m per km · fine-grained 724.15 km from the source: 157 m · falling 0.3 m per km · fine-grained 727.14 km from the source: 157 m · falling 0.3 m per km · fine-grained 730.13 km from the source: 156 m · falling 0.3 m per km · fine-grained 733.13 km from the source: 156 m · falling 0.3 m per km · fine-grained 736.12 km from the source: 154 m · falling 0.3 m per km · fine-grained 739.11 km from the source: 153 m · falling 0.3 m per km · fine-grained 742.1 km from the source: 153 m · falling 0.3 m per km · fine-grained 745.09 km from the source: 151 m · falling 0.3 m per km · fine-grained 748.09 km from the source: 150 m · falling 0.2 m per km · fine-grained 751.08 km from the source: 150 m · falling 0.2 m per km · fine-grained 754.07 km from the source: 150 m · falling 0.2 m per km · fine-grained, floodout 757.06 km from the source: 150 m · falling 0.1 m per km · fine-grained 760.06 km from the source: 151 m · falling 0.2 m per km · fine-grained 763.05 km from the source: 147 m · falling 0.2 m per km · fine-grained 766.04 km from the source: 146 m · falling 0.2 m per km · fine-grained 769.03 km from the source: 149 m · falling 0.3 m per km · fine-grained, floodout 772.03 km from the source: 147 m · falling 0.4 m per km · fine-grained, floodout 775.02 km from the source: 145 m · falling 0.4 m per km · fine-grained, floodout 778.01 km from the source: 143 m · falling 0.4 m per km · fine-grained 781 km from the source: 143 m · falling 0.4 m per km · fine-grained 783.99 km from the source: 141 m · falling 0.4 m per km · fine-grained 786.99 km from the source: 139 m · falling 0.3 m per km · fine-grained 789.98 km from the source: 138 m · falling 0.2 m per km · fine-grained 792.97 km from the source: 140 m · falling 0.2 m per km · fine-grained, floodout 795.96 km from the source: 140 m · falling 0.3 m per km · fine-grained 798.96 km from the source: 137 m · falling 0.3 m per km · fine-grained 801.95 km from the source: 135 m · falling 0.3 m per km · fine-grained 804.94 km from the source: 137 m · falling 0.4 m per km · fine-grained 807.93 km from the source: 134 m · falling 0.4 m per km · fine-grained 810.93 km from the source: 133 m · falling 0.3 m per km · fine-grained 813.92 km from the source: 133 m · falling 0.3 m per km · fine-grained 816.91 km from the source: 130 m · falling 0.3 m per km · fine-grained 819.9 km from the source: 130 m · falling 0.2 m per km · fine-grained 822.9 km from the source: 130 m · falling 0.2 m per km · fine-grained 825.89 km from the source: 129 m · falling 0.2 m per km · fine-grained 828.88 km from the source: 129 m · falling 0.2 m per km · fine-grained 831.87 km from the source: 128 m · falling 0.2 m per km · fine-grained 834.86 km from the source: 129 m · falling 0.2 m per km · fine-grained 837.86 km from the source: 128 m · falling 0.3 m per km · fine-grained 840.85 km from the source: 126 m · falling 0.3 m per km · fine-grained 843.84 km from the source: 124 m · falling 0.2 m per km · fine-grained 846.83 km from the source: 126 m · falling 0.2 m per km · fine-grained 849.83 km from the source: 123 m · falling 0.1 m per km · fine-grained 852.82 km from the source: 125 m · falling 0.1 m per km · fine-grained 855.81 km from the source: 124 m · falling 0 m per km · fine-grained 858.8 km from the source: 123 m · falling 0 m per km · fine-grained 861.8 km from the source: 123 m · falling 0 m per km · fine-grained 864.79 km from the source: 124 m · falling 0 m per km · fine-grained 867.78 km from the source: 125 m · falling 0 m per km · fine-grained 870.77 km from the source: 123 m · falling 0 m per km 873.77 km from the source: 124 m · falling 0 m per km · fine-grained 876.76 km from the source: 126 m · falling 0.1 m per km · fine-grained 879.75 km from the source: 124 m · falling 0.2 m per km 882.74 km from the source: 122 m · falling 0.2 m per km 885.73 km from the source: 123 m · falling 0.2 m per km · fine-grained 888.73 km from the source: 121 m · falling 0.2 m per km · fine-grained 891.72 km from the source: 122 m · falling 0.2 m per km · fine-grained 894.71 km from the source: 120 m · falling 0.1 m per km · fine-grained 0 km 224 km 447 km 671 km 895 km
bedrock · 3% gravel · 28% sand · 18% fine-grained · 43% variable · 0% unstated · 6% not surveyed · 1%
Headwater
666 m
Outlet
120 m
Typical drop
0.6 m/km
Steepest sampled stretch
4.7 m/km, near 77.8 km
Hover the profile for the reading at any kilometre.
Source: Geoscience Australia.
Source details and licence

Geoscience Australia — 1 second SRTM-derived DEM-H v1.0 (NCI tile store). Geoscience Australia, 1 second SRTM-derived DEM-H v1.0, © Commonwealth of Australia, CC BY 4.0. retrieved 2026-08-16.

Bed material: NSW Department of Climate Change, Energy, the Environment and Water (Water, Surface Water Science).
Source details and licence

NSW River Styles spatial dataset — geomorphic character and dominant bed material. NSW River Styles spatial dataset, © State Government of NSW and NSW Department of Climate Change, Energy, the Environment and Water 2023. retrieved 2026-08-21.

Gauge pins identify the monitoring stations. The slope shows how steeply the river falls; it does not show rapids or safe wading routes.

The banks, seen from space

Land cover in the 120 m beside the water, Landsat 2023 to 2024 to 2025

0 to 50 km: woody dense 0.4% 0 to 50 km: woody open 31.6% 0 to 50 km: woody sparse 1.8% 0 to 50 km: herbaceous native 32.1% 0 to 50 km: cultivated 33.2% 0 to 50 km: bare 0.1% 0 to 50 km: artificial 0.8% 50 to 100 km: woody dense 0.3% 50 to 100 km: woody open 56.5% 50 to 100 km: woody sparse 9.6% 50 to 100 km: herbaceous native 32.8% 50 to 100 km: cultivated 0.7% 50 to 100 km: bare 0.1% 100 to 150 km: woody dense 0.4% 100 to 150 km: woody open 54.5% 100 to 150 km: woody sparse 11.6% 100 to 150 km: herbaceous native 30.8% 100 to 150 km: cultivated 2.3% 100 to 150 km: bare 0.4% 150 to 200 km: woody open 40.9% 150 to 200 km: woody sparse 5.2% 150 to 200 km: herbaceous native 46.9% 150 to 200 km: cultivated 6.2% 150 to 200 km: bare 0.8% 200 to 250 km: woody dense 10.6% 200 to 250 km: woody open 42.9% 200 to 250 km: woody sparse 1.8% 200 to 250 km: herbaceous native 30.2% 200 to 250 km: cultivated 14.5% 250 to 300 km: woody dense 6% 250 to 300 km: woody open 31.2% 250 to 300 km: woody sparse 2.6% 250 to 300 km: herbaceous native 17.6% 250 to 300 km: cultivated 42.4% 250 to 300 km: artificial 0.2% 300 to 350 km: woody dense 3.9% 300 to 350 km: woody open 27.2% 300 to 350 km: woody sparse 2.1% 300 to 350 km: herbaceous native 19% 300 to 350 km: cultivated 46.8% 300 to 350 km: bare 0.3% 300 to 350 km: artificial 0.7% 350 to 400 km: woody dense 6.4% 350 to 400 km: woody open 29.8% 350 to 400 km: woody sparse 1.1% 350 to 400 km: herbaceous native 18.3% 350 to 400 km: cultivated 43.9% 350 to 400 km: bare 0.5% 400 to 450 km: woody dense 10.5% 400 to 450 km: woody open 27.5% 400 to 450 km: woody sparse 0.8% 400 to 450 km: herbaceous native 13% 400 to 450 km: cultivated 47.6% 400 to 450 km: bare 0.6% 450 to 500 km: woody dense 17.4% 450 to 500 km: woody open 29% 450 to 500 km: woody sparse 1.5% 450 to 500 km: herbaceous native 16.7% 450 to 500 km: cultivated 34.8% 450 to 500 km: bare 0.6% 500 to 550 km: woody dense 14% 500 to 550 km: woody open 38.9% 500 to 550 km: woody sparse 1.4% 500 to 550 km: herbaceous native 18.6% 500 to 550 km: cultivated 27% 500 to 550 km: bare 0.1% 550 to 600 km: woody dense 19.6% 550 to 600 km: woody open 48.6% 550 to 600 km: woody sparse 2.6% 550 to 600 km: herbaceous native 12.2% 550 to 600 km: cultivated 16% 550 to 600 km: bare 0.3% 550 to 600 km: artificial 0.7% 600 to 650 km: woody dense 15.6% 600 to 650 km: woody open 64.2% 600 to 650 km: woody sparse 1.7% 600 to 650 km: herbaceous native 12.2% 600 to 650 km: cultivated 5.9% 600 to 650 km: bare 0.4% 650 to 700 km: woody dense 7.7% 650 to 700 km: woody open 58.5% 650 to 700 km: woody sparse 2.4% 650 to 700 km: herbaceous native 25.5% 650 to 700 km: cultivated 5.8% 650 to 700 km: bare 0.1% 700 to 750 km: woody dense 1.2% 700 to 750 km: woody open 49.4% 700 to 750 km: woody sparse 2.5% 700 to 750 km: herbaceous native 43.1% 700 to 750 km: cultivated 3% 700 to 750 km: bare 0.8% 750 to 800 km: woody dense 3.2% 750 to 800 km: woody open 68.6% 750 to 800 km: woody sparse 3.5% 750 to 800 km: herbaceous native 16.1% 750 to 800 km: cultivated 8.6% 800 to 850 km: woody open 28.3% 800 to 850 km: woody sparse 3% 800 to 850 km: herbaceous native 67.9% 800 to 850 km: cultivated 0.8% 850 to 897.5 km: woody open 21.1% 850 to 897.5 km: woody sparse 7.9% 850 to 897.5 km: herbaceous native 70.4% 850 to 897.5 km: cultivated 0.5% 850 to 897.5 km: bare 0.1% 0 km 50 km 100 km 150 km 200 km 250 km 300 km 350 km 400 km 450 km 500 km 550 km 600 km 650 km 700 km 750 km 800 km 850 km
dense forest open woodland scattered trees and scrub native grass and heath farmed or cleared bare ground lake
Along the river itself about 52% of the bank is under trees, 29% is native grass or heath and 19% is farmed. The most wooded stretch is 600 to 650 km from the source; the most open is 850 to 897.5 km. A satellite reads the canopy, not the ground beneath it, so treat this as a read of the country, not a survey of every bank.
Source: Geoscience Australia / Digital Earth Australia.
Source details and licence

DEA Land Cover (Landsat) — Level 4 classification, continental mosaics. © Commonwealth of Australia (Geoscience Australia). DEA Land Cover (Landsat), Digital Earth Australia. retrieved 2026-08-19.

How well this water has been surveyed

109 capture records, 2 decades of 2 on file

0 20 40 60 80 2000s: 41 capture records 2000s: 5 capture records 2000s: 2 capture records 2010s: 42 capture records 2010s: 18 capture records 2010s: 1 capture record 2000s 2010s
electrofishing (boat), 83 records electrofishing (backpack), 5 records seine netting, 18 records trapping, 3 records
Capture records by decade — electrofishing, netting, trapping and rotenone surveys only; a sighting, an eDNA water sample or a stocking release is not a capture and is not counted here. A record is not an abundance estimate, and a decade with no bar is a decade with no capture survey on file, not evidence the water was empty.
Source: Atlas of Living Australia.
Source details and licence

Atlas of Living Australia — freshwater fish occurrence records (open licences, with coordinates). Occurrence records from the Atlas of Living Australia and its contributing datasets, including the Victorian Biodiversity Atlas, NSW BioNet Atlas, Sustainable Rivers Audit, Murray-Darling Basin fish monitoring programs, OZCAM museum collections and iNaturalist Australia. Each record carries its own licence and originating dataset. retrieved 2026-08-13.

Stocking on record

736,158 fish in 198 records, 2020 to 2026

0 50k 100k 150k 2020: 32,818 golden perch in 19 records 2021: 59,805 murray cod in 21 records 2021: 62,621 golden perch in 13 records 2022: 91,000 murray cod in 13 records 2022: 44,644 golden perch in 4 records 2023: 114,001 murray cod in 19 records 2023: 16,494 golden perch in 3 records 2024: 18,238 murray cod in 4 records 2024: 34,658 golden perch in 15 records 2025: 92,831 murray cod in 25 records 2025: 45,446 golden perch in 27 records 2026: 86,648 murray cod in 21 records 2026: 36,954 golden perch in 14 records 2020 2021 2022 2023 2024 2025 2026
Murray Cod, 462,523 across 103 records Golden Perch, 273,635 across 95 records
Stocked in 7 of the 7 years from 2020 to 2026. These are site-by-year totals, which can combine more than one release. A record is not a promise that stocking continues, and not evidence of what is in the water now.
Source: NSW Department of Primary Industries and Regional Development (Fisheries).
Source details and licence

NSW Fish Stocking — ArcGIS site markers and linked histories. retrieved 2026-08-29.

Conditions

What the gauges say

Macquarie River at Carinda (Bells Bridge)

River flow

No reading shown: No reading has been captured for this gauge yet, so none is shown.

Gauge height

No reading shown: No reading has been captured for this gauge yet, so none is shown.

Water temperature

No reading shown: No reading has been captured for this gauge yet, so none is shown.

Macquarie River at Oxley Station

River flow

No reading shown: No reading has been captured for this gauge yet, so none is shown.

Gauge height

No reading shown: No reading has been captured for this gauge yet, so none is shown.

Macquarie River at Gin Gin

River flow

No reading shown: No reading has been captured for this gauge yet, so none is shown.

Gauge height

No reading shown: No reading has been captured for this gauge yet, so none is shown.

Macquarie River at downstream Burrendong Dam

River flow

No reading shown: No reading has been captured for this gauge yet, so none is shown.

Gauge height

No reading shown: No reading has been captured for this gauge yet, so none is shown.

Water temperature

No reading shown: No reading has been captured for this gauge yet, so none is shown.

Water clarity

No reading shown: No reading has been captured for this gauge yet, so none is shown.

Macquarie River at D/s Marebone Weir

River flow

No reading shown: No reading has been captured for this gauge yet, so none is shown.

Gauge height

No reading shown: No reading has been captured for this gauge yet, so none is shown.

Water temperature

No reading shown: No reading has been captured for this gauge yet, so none is shown.

Macquarie River at Gibson Way

River flow

No reading shown: No reading has been captured for this gauge yet, so none is shown.

Gauge height

No reading shown: No reading has been captured for this gauge yet, so none is shown.

Macquarie River at Baroona

River flow

No reading shown: No reading has been captured for this gauge yet, so none is shown.

Gauge height

No reading shown: No reading has been captured for this gauge yet, so none is shown.

Water temperature

No reading shown: No reading has been captured for this gauge yet, so none is shown.

Macquarie River at Miltara

River flow

No reading shown: No reading has been captured for this gauge yet, so none is shown.

Gauge height

No reading shown: No reading has been captured for this gauge yet, so none is shown.

Macquarie River at Pillicawarrina

River flow

No reading shown: No reading has been captured for this gauge yet, so none is shown.

Gauge height

No reading shown: No reading has been captured for this gauge yet, so none is shown.

Macquarie River at Yarracoona

River flow

No reading shown: No reading has been captured for this gauge yet, so none is shown.

Gauge height

No reading shown: No reading has been captured for this gauge yet, so none is shown.

Water temperature

No reading shown: No reading has been captured for this gauge yet, so none is shown.

Macquarie River downstream Long Point

River flow

No reading shown: No reading has been captured for this gauge yet, so none is shown.

Gauge height

No reading shown: No reading has been captured for this gauge yet, so none is shown.

Macquarie River at Wollombi (Geurie)

River flow

No reading shown: No reading has been captured for this gauge yet, so none is shown.

Gauge height

No reading shown: No reading has been captured for this gauge yet, so none is shown.

Macquarie River at Brewon Bridge

River flow

No reading shown: No reading has been captured for this gauge yet, so none is shown.

Gauge height

No reading shown: No reading has been captured for this gauge yet, so none is shown.

Readings from the Bureau of Meteorology's Water Data Online, © Commonwealth of Australia, licensed CC BY 4.0. Nothing here is a forecast. Check the gauge before you rely on it.

Weather

What the sky is doing

Live weather for Macquarie River downstream Long Point loads here. If it does not, check the Bureau of Meteorology forecast before you go.

Weather data by Open-Meteo.com

Questions anglers ask

Where should I start on a first visit?

At the parks at Eglinton, just downstream of Bathurst, which a local fishing site names as water with a little less pressure than the town stretch. Fish a bead-head Woolly Bugger along the rock and cover for golden perch and cod, and look for carp on the edges if the water is clear.

Is this the Macquarie River with the red spinners?

No. That is the Macquarie River in the Tasmanian Midlands, a different water with its own page. This is the NSW river that rises above Bathurst and runs west to the Barwon.

Are there trout in the Macquarie?

Yes, but the trout listing does not cover the river itself. The tributaries upstream of and including Lewis Ponds Creek are listed general trout waters, and rainbows are described as the usual target upstream of Burrendong. A small brown from the river at Bathurst is recorded by a FlyLife writer; treat trout in the main river as a bonus and fish the listed tributaries for them.

When can I fish for cod?

Check the current NSW rules for any Murray cod closed season and for the size and bag limits before you go, and check which natives are on the current protected list.

Can I camp along the river?

The Bridle Trail, a historic 4WD-only track from Hill End to Bathurst alongside the Macquarie and Turon, has six camping sites, though the rivers cannot be reached for the full length of the track. Check current track conditions before you commit to it.

Behind this page