Lake Purrumbete is a clear, fertile crater lake in Western Victoria, and people drive to it for big trout and salmon.
It is a single body of water with no stretches to choose between.
Start on the eastern shoreline. FlyLife's writers call it a favourite land-based spot.
Check the current Victorian Fisheries Authority guide before you fish.
Water and habitat
Purrumbete is a crater lake, and FlyLife's writers describe clear, fertile water with lush weed beds that grow trout fast.
The same writers describe the eastern shoreline as having dark gravel and sand channels between the shore and the weed beds. Fish can be reached from the bank there, and wading is easy.
Fish and forage
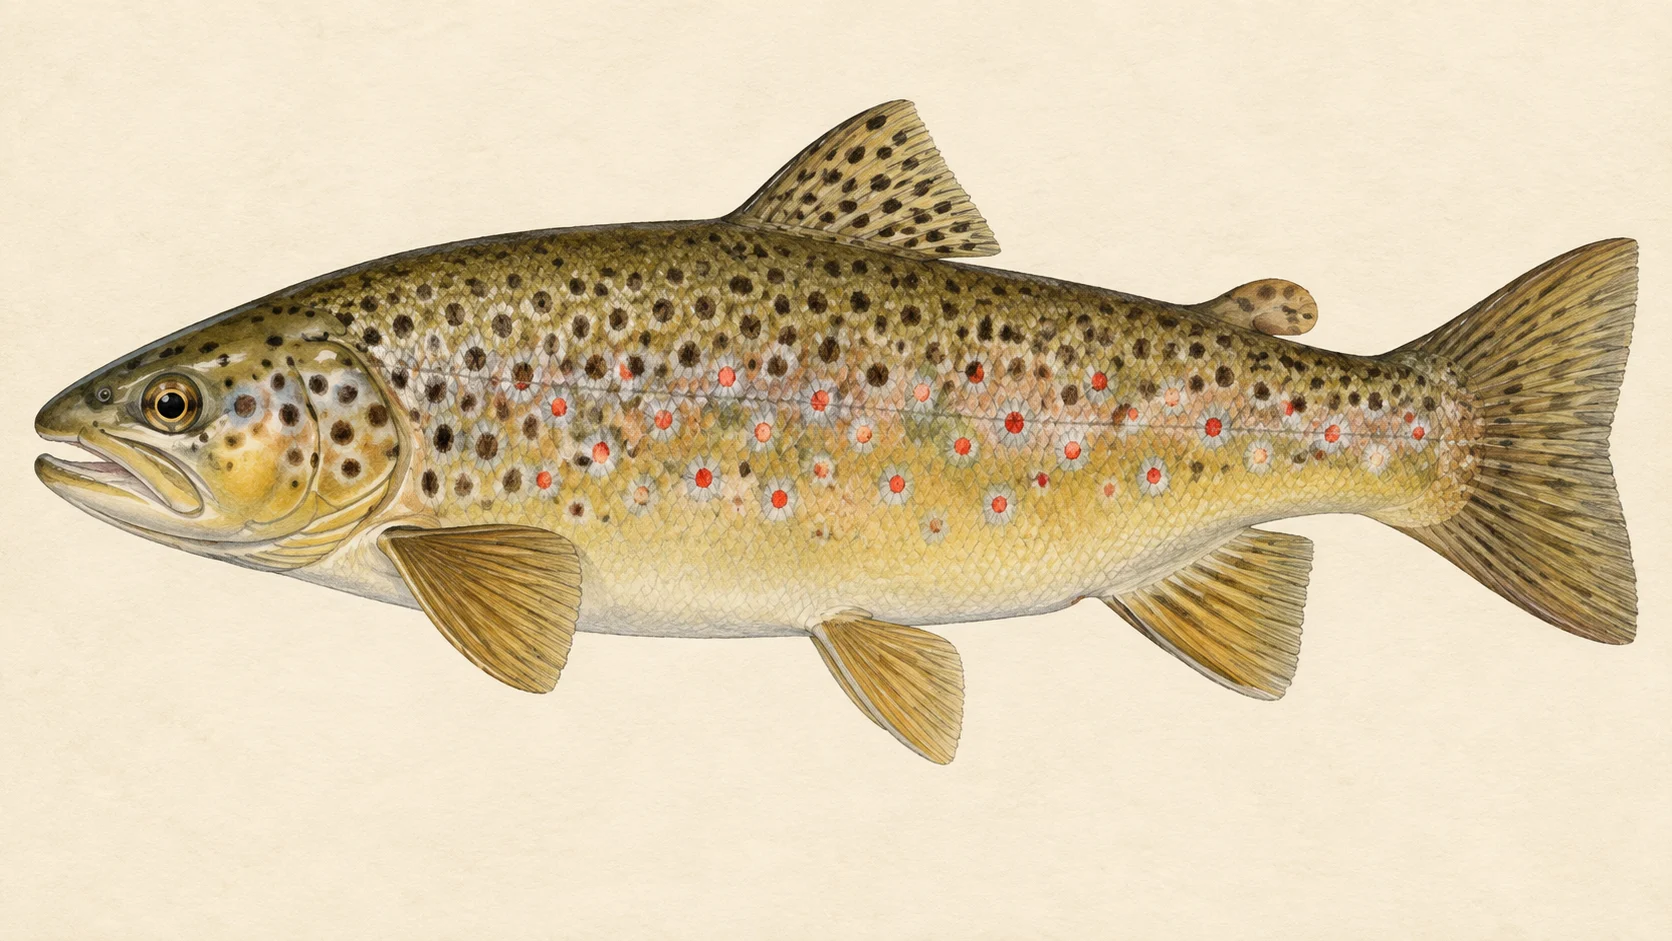
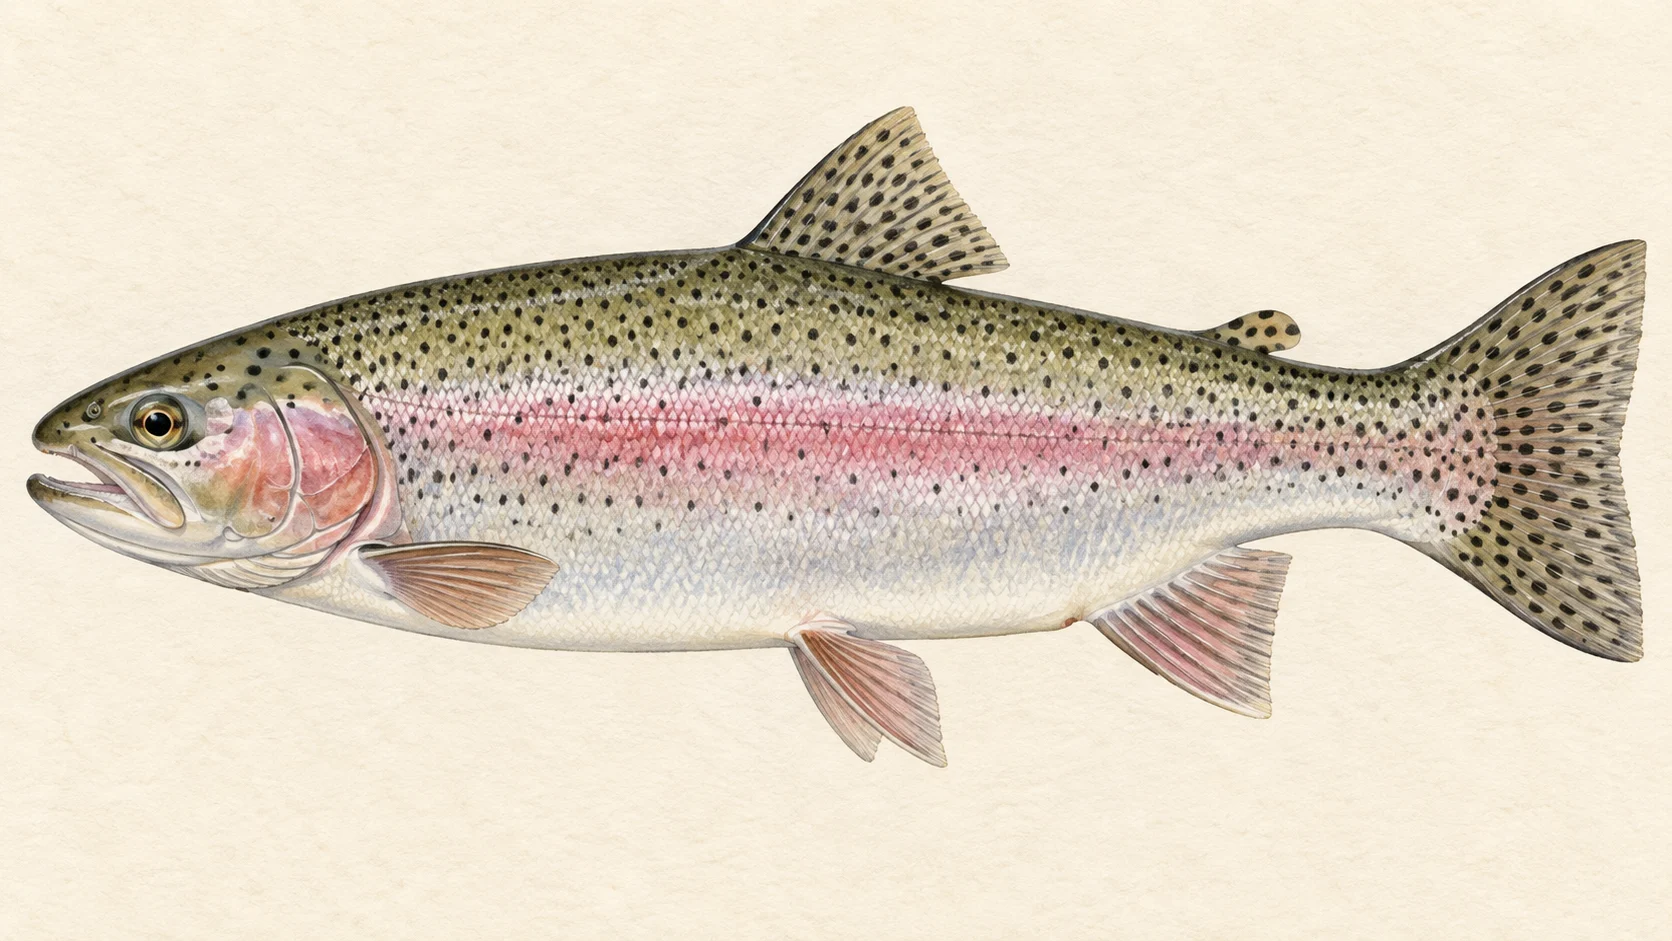
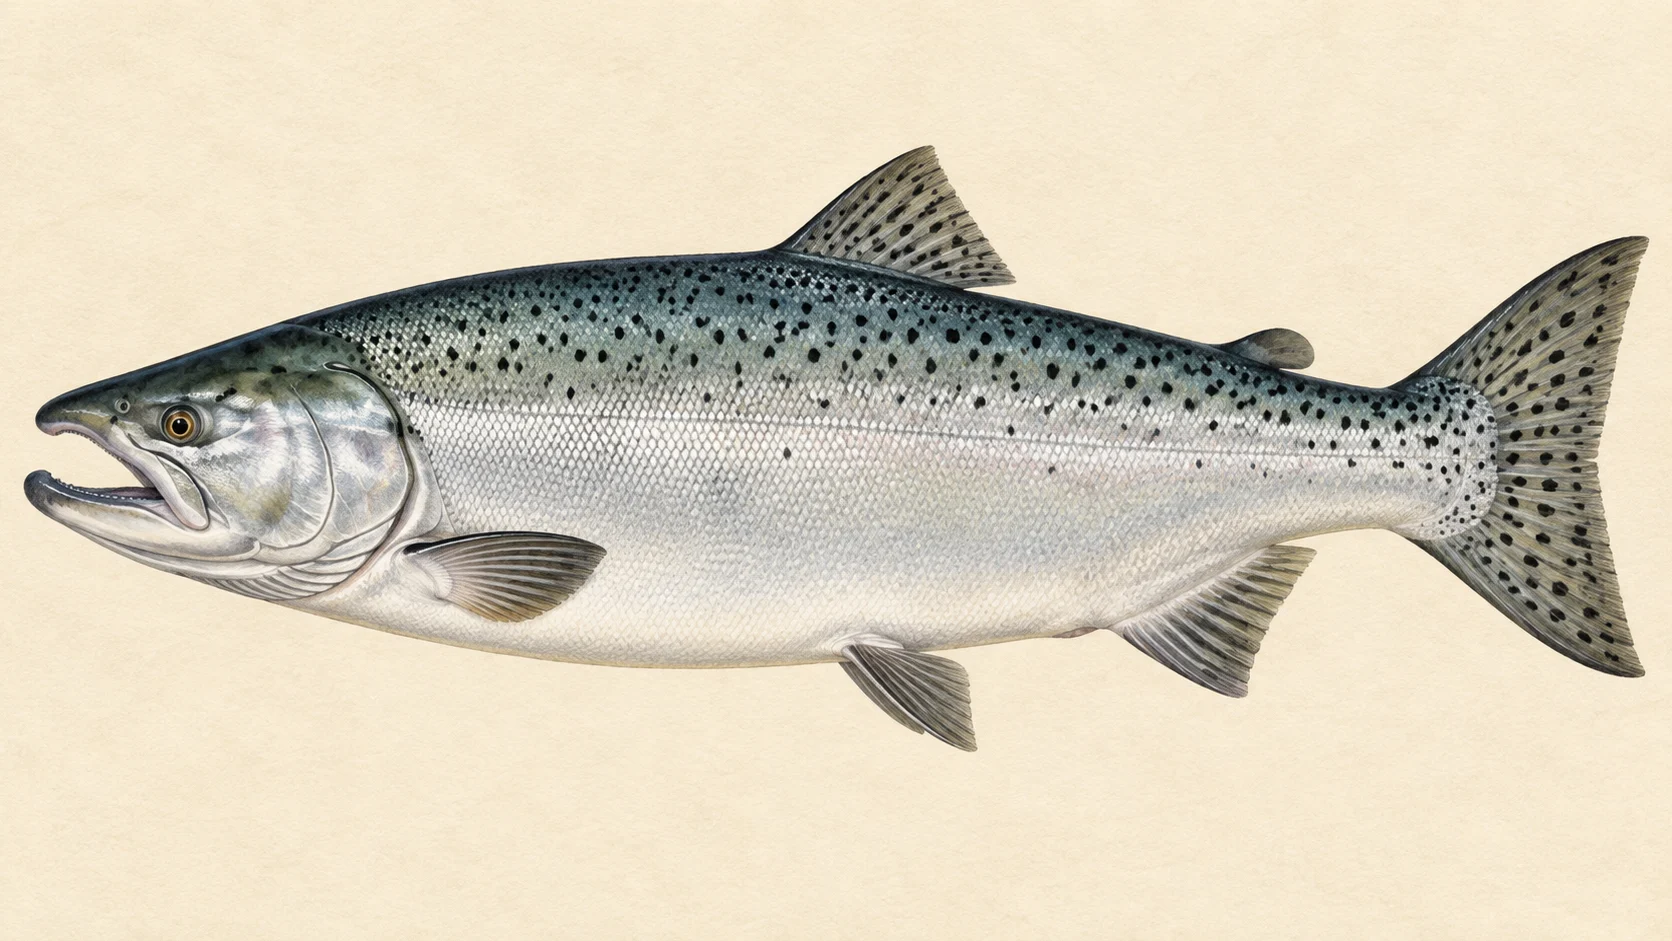
The lake holds brown trout and rainbow trout, along with chinook salmon and English perch. The stocking chart shows the browns and rainbows going in across many seasons, and chinook salmon have been released as well, so the fishery is built on regular stocking rather than on chance.
The survey chart shows the smaller fish recorded in the lake. Treat any of them as forage a trout may be feeding on.
When to fish it
FlyLife's writers say Purrumbete and the other Western Victorian lakes begin to fish well as air and water temperatures drop. The season set out in the Victorian Fisheries Authority guide decides which days you can fish.
How to fish it
Fish the shoreline channels rather than blind water, and move along the bank until you find where the fish are.
Access and safety
The lake is reached via Purrumbete Estate Road. Access for recreational anglers was improved with a recreational fishing licence grant, which the Victorian Fisheries Authority notes in its guide. Treat any way in as a description, not a statement of permission, and respect the fences and signs you meet.
As on any lake shore, tell someone where you are going and when you expect to be back, and watch your footing when you wade.
Regulations
Before you fish, read the current Victorian Fisheries Authority recreational fishing guide, including its closed-waters list, and take any season, bag and size limits and licence requirements from it.
What the record shows
Flows, river gradient, changing water levels, fish surveys and stocking
What the record shows
How wet the lake has stayed
Satellite record, 1986 to 2026
The share of the mapped water body that was wet each month, from satellite imagery since 1986. This is not a level record — a satellite reads surface extent, never depth — but a shrinking wet area usually means a lower lake. Over 290 months on file the wet share has run from 6% to 99%; the latest reading is 92%, 2026-08.
Capture records by decade — electrofishing, netting, trapping and rotenone surveys only; a sighting, an eDNA water sample or a stocking release is not a capture and is not counted here. A record is not an abundance estimate, and a decade with no bar is a decade with no capture survey on file, not evidence the water was empty.
Atlas of Living Australia — freshwater fish occurrence records (open licences, with coordinates). Occurrence records from the Atlas of Living Australia and its contributing datasets, including the Victorian Biodiversity Atlas, NSW BioNet Atlas, Sustainable Rivers Audit, Murray-Darling Basin fish monitoring programs, OZCAM museum collections and iNaturalist Australia. Each record carries its own licence and originating dataset. retrieved 2026-08-13.
Stocking on record
1,596,773 fish in 395 records, 1990 to 2025
Chinook Salmon, 627,246 across 129 recordsRainbow Trout, 492,930 across 134 recordsBrown Trout, 454,982 across 124 recordsAtlantic Salmon, 15,345 across 5 recordsBrook Trout, 6,270 across 3 records
Stocked in 36 of the 36 years from 1990 to 2025. These are individual release records. A record is not a promise that stocking continues, and not evidence of what is in the water now.
Source: Victorian Fisheries Authority. Source details and licence
Victorian Fisheries Authority fish stocking database. retrieved 2026-08-21.
Conditions
What the gauges say
Check the water operator or jurisdiction authority for current conditions, and read the water yourself when you arrive.
Questions anglers ask
What will I catch?+
Brown and rainbow trout, chinook salmon and English perch are the fish to plan for. The stocking chart shows which species have been released and when.
Can I fish it from the bank?+
FlyLife's writers describe the eastern shoreline as a favourite land-based spot, with fish reachable from the bank and easy wading between the shore and the weed beds.
Is there a closed season or a special rule?+
Check the current Victorian Fisheries Authority recreational fishing guide before you fish, and take any season, bag and size limits from it.
When does it fish best?+
FlyLife's writers say the lakes of Western Victoria begin to fish well as air and water temperatures drop.